Viewing Device Connection Status
You can view device status, behavior, and connection-related information in chart form on the Connection Dashboard.
Prerequisites
Ensure you have the Developer role to access the Developer Console in Application Portal. If you don’t have this role, contact the OU administrator to add it.
Procedure
In the Developer Console of EnOS Application Portal, select Operations Monitoring > Connection Dashboard. The dashboard displays data for all devices from the past 1 hour by default.
You can change the Time in the upper left corner of the page to view device status for the past 1 day, 7 days, or 30 days, with a refresh rate of every minute.
Click the Refresh button in the upper right corner of the page to retrieve the latest results.
To switch chart types, click the
 Chart button on the right side of the chart to toggle.
Hover your mouse over the chart to view the specific values at the corresponding position.
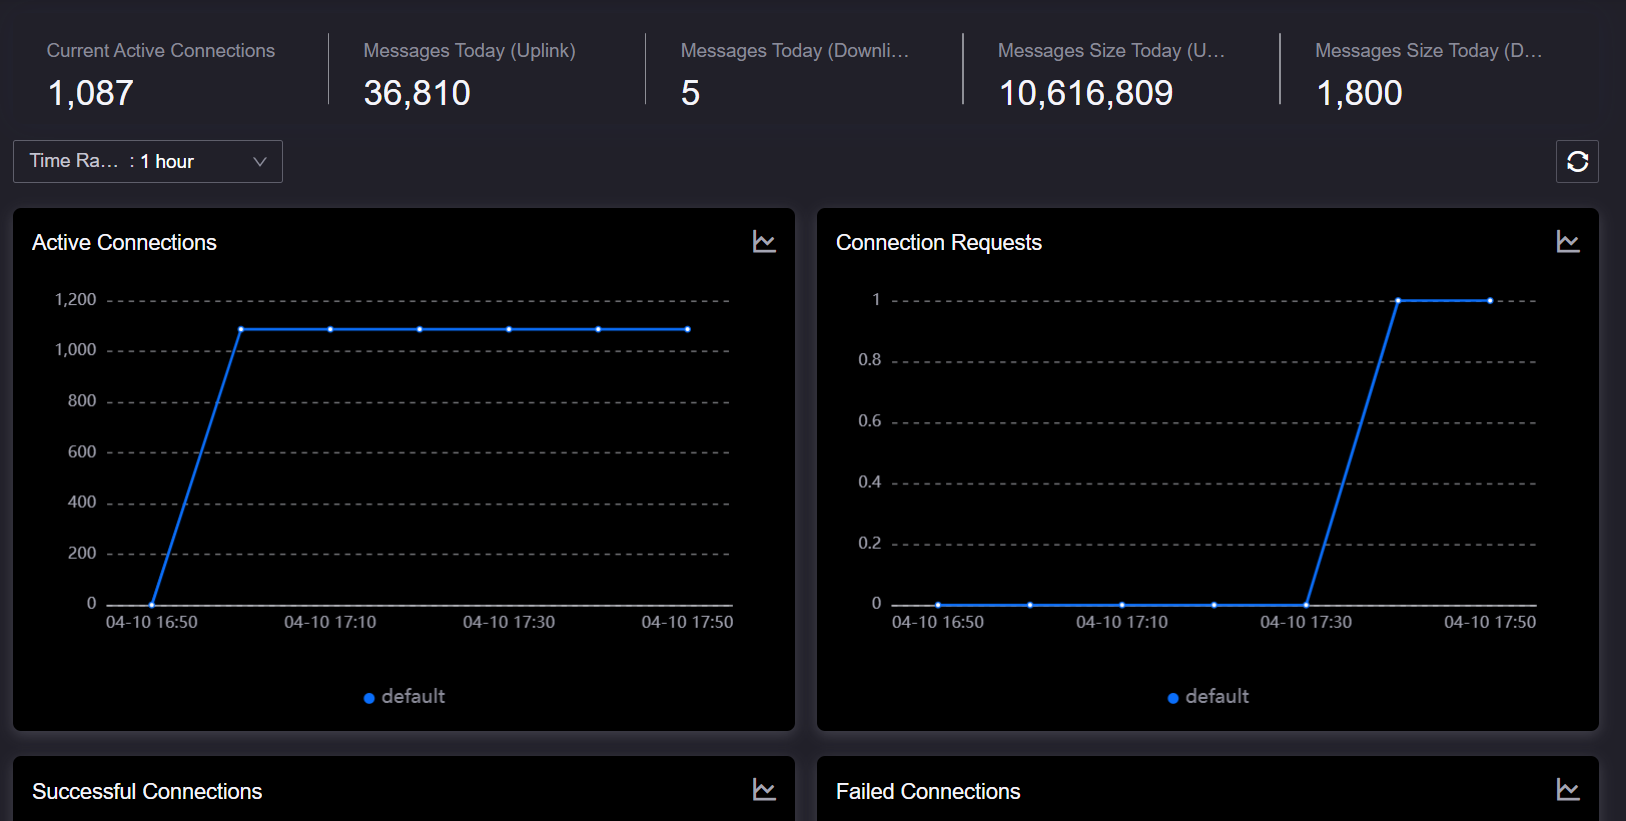
Chart Description
On the Connection Dashboard, you can access the following data.
Connections
After devices connect to the cloud via the MQTT or HTTP protocol, you can view the device connection count for the current OU, including:
Active Connections: The number of device connections that have successfully established and maintained communication with the EnOS cloud at a specific moment. This is an instantaneous value reflecting the current online connection status. When a device connects to the cloud through a gateway, only the gateway-to-cloud connection is counted, not the sub-device connections directly.
Connection Requests: The total number of connection requests initiated by devices to the EnOS cloud within the selected time range, including all attempts to establish a connection, whether successful or not.
Successful Connections: The number of times devices successfully established a connection with the EnOS cloud within the selected time range. A successful connection typically means the device has been activated, but it does not indicate that the device is currently active.
Failed Connections: The number of times devices attempted to connect to the EnOS cloud but failed to establish a connection within the selected time range. Failed Connections = Connection Requests - Successful Connections.
Message Size
When devices transmit data to the EnOS cloud directly via the MQTT protocol or indirectly through a third-party service, EnOS will calculate the size of uplink and downlink messages in bytes and display it on the Connection Dashboard.
Message Size (Uplink): The number of message bytes received by EnOS from devices or services within the selected time range.
Message Size (Downlink): The number of message bytes pushed by EnOS to devices or services within the selected time range.
Messages
Device Connectivity and Management will convert message size into message count based on a standard of 512 bytes per message. The unit is “messages,” and it is displayed on the Connection Dashboard.
Messages (Uplink): The number of messages received by EnOS from devices or services within the selected time range.
Messages (Downlink): The number of messages pushed by EnOS to devices or services within the selected time range.