Configuring Portfolio
The page describes how application creators configure Portfolio pages.
Prerequisites
Before you start, make sure that:
You have the required asset permissions, operational permissions, and access permissions for Portfolio pages. Contact the application administrator to get the required permissions.
You have registered the attributes, measurement points, and metrics of target assets in Common Data Service (CDS). For more information, see About EnOS Common Data Service.
Configuring Asset Dimensions
Asset Dimension refers to the scope displayed on the asset map of the Portfolio page, containing Global, Region and Site, where
Global displays the asset information of sites in multiple regions.
Region displays the asset information of sites in a specified region.
Site displays the asset information in a specified region.
To configure the details of each dimension, contact the system administrator.
Build a Portfolio page for a specified dimension or covering multiple dimensions by the following steps:
Select Portfolio from the left navigation pane.
Note
The menu name in your applications might be different from the name in this article, because of the customization on menu names for Unified Monitoring pages. Contact the application administrator for more information.
Select the configuration icon
 to configure the Portfolio page.
In the Asset Dimension section, you can select the following dimensions.
Asset Dimension
Description
Global
the asset map for multiple regions and sites
Region
the asset map for multiple sites in a single region
Site
the asset map for a single site
In the Site Type section, select the site types displayed on the Portfolio page. If you need to select types that are not listed from the dropdown list, contact the system administrator.
Configuring Page Layouts
The layout of the Portfolio page determines the placement of canvases and filters on the Portfolio page. You can select the most suitable layout from multiple layout styles to meet the needs on visualized monitoring pages. Configure the layout of the Portfolio page by the following steps:
Select Portfolio from the left navigation pane.
Select the configuration icon
to configure the Portfolio page.Select the Layout Settings tab.
Hover of the layout you want to choose and select Apply to apply the layout. You can select the following Portfolio layouts.
Layout
Description
Left & Right - Regular
A narrow canvas on the left and a wide canvas on the right, with the filter above the left canvas.
Left & Right - Floating
Wide canvases on both left and right, with the filter above the left canvas
Top, Left, Right - Floating
Wide canvases on both left and right, and a narrow canvas on top, with the filter above the left canvas
Top & Right - Floating
A wide canvas on the right and a narrow canvas on top, with the filter below the top canvas
Right & Bottom - Floating
A wide canvas on the right and a narrow canvas on bottom, with the filter in the top left corner.
All Borders - Floating
Wide canvases on both the left and right and narrow canvases on both top and bottom, with the filter above the left canvas
Configure the following information in the Layouts section.
Field
Description
Show Title Bar
Enable this function to display the page title in the top left corner of the Portfolio page.
Auto Fullscreen
Enable this function to display the Portfolio page in full screen when application users open the page.
Configuring Asset Maps
You can select multiple map types and sources and configure a rich set of functions for the asset map in the Portfolio page to display the distribution and data of assets within a specified geographical range. Configure the asset map in the Portfolio page by the following steps:
Select Portfolio from the left navigation pane.
Select the configuration icon
to configure the Portfolio page.Select the Map Settings tab.
Enter the following information to configure the asset map.
Note
You can only configure the map type, asset aggregation, and default view for a site map.
Show Map: enabled by default. If you disable this function, you cannot configure or view asset maps on the Portfolio page.
Map Types: select the following types and sources.
Map Type
Description
Administrative Map
Supporting Global, Region, and Site dimensions.
Geographical Map
Supporting Global, Region, and Site dimensions.
Road Map
Supporting Global, Region, and Site dimensions.
Electronic Chart
Supporting Global, Region, and Site dimensions.
3D Map
Supporting Site dimension.
Max Zoom in Level: specify the max zoom-in level for geographical maps, road maps, electronic charts, and 3D maps.
Configure the following information in the Global (for the Global dimension) or the Region (for the region dimension) section.
Map Types: select the map types for the current asset dimension.
Default Map Type: select the map type displayed on the Portfolio page by default for the current asset dimension.
For an administrative map, enter the following information.
Field
Description
Default View
Select the administrative scope displayed on the administrative map by default, supporting
WorldandChina.Show Minimap
Display the global administrative minimap in the bottom right corner of the asset map.
Background Color
Select the background color of the administrative map.
Show Heat Map
Display certain data for each administrative region by color blocks. If you want to customize the data displayed on heap maps, contact the system administrator.
Show Headline of Heat Map
Display the headline of the heat map.
Enable Asset Aggregation
Display the total data of all assets within the certain range specified in Aggregate By.
Aggregate By
After enabling Enable Asset Aggregation, select the method to aggregate assets, currently supporting
regionto aggregate assets by region.
For example, selectingRegionand all assets in a region will be aggregated as 1 asset icon on the map.Looping Display by Regions
After enabling Enable Asset Aggregation, display the heat map data of each administrative region by a floating card.
Sorting Rule
After enabling Looping Display by Regions, specify the rule on which the order of looping display is based, currently supporting
By Heat Map Datato sort the order by heat map data.Display Order
After enabling Looping Display by Regions, select the order of looping display, supporting
Largest to SmallestandSmallest to Largest.Looping Interval
After enabling Looping Display by Regions, specify the display duration of each floating card.
Enlarge Font
Display the text in the administrative map with a larger font size.
For a geographical map, road map, electronic chart or 3D map, enter the following information.
Field
Description
Zoom Granularity
Specify the zoom scale of the map when adjusting the zoom level by one unit.
The default value is1, you can choose between0 - 1with the accuracy of0.1. The smaller the value is, the more accurately you can zoom in and out of the map.Auto-Center Default View
Automatically select the center of the map and the minimum zoom-in level.
If you need to specify a certain coordinate as the map center, disable this function and enter the coordinates of the map center and the default zoom-in level.Enable Asset Aggregation
Display asset data based on specified methods which can be configured in the Aggregate By section.
Aggregate By
After enabling Enable Asset Aggregation, select the method to aggregate assets, currently supporting
Regionto aggregate assets by region andprovinceto aggregate assets by province.
For example, selectingRegionand all assets in a region will be aggregated as 1 asset icon on the map.Aggregation Zoom Level
After enabling Enable Asset Aggregation, select the scale of the asset aggregation between
1-18with the accuracy of1.Looping Display by Provinces
After enabling Enable Asset Aggregation, display the heat map data of each province-level administrative region by a floating card.
Data to Loop
After enabling Looping Display by Provinces,select the data fields displayed on the floating cards and the display order and duration.
Display Data on Aggregation Icons
After selecting
Regionin Aggregate By, select the data displayed on the aggregation icon and configure the data name, unit, format and aggregation rule.Donut Chart
After selecting
Regionin Aggregate By, display the aggregation icons as donut charts, select the data displayed on the donut charts and configure the data name and color.
If you want to display the progress towards a goal or metrics in percentage on aggregated site icons, you can enable this function and configure corresponding data information.
Configuring Assets
You can view details of multiple assets such as basic information, geographical information, and running status in the Portfolio page with asset filter and map links. Configure the assets in the Portfolio page by the following steps:
Select Portfolio from the left navigation pane.
Select the configuration icon
to configure the Portfolio page.Select the Asset Settings tab.
Select Asset Filter to enable the filter for quickly locating the target assets and viewing the details of the assets.
Configure the following information in the Global (for the Global dimension) or the Region (for the region dimension) section.
Field
Description
Site Type
Select the types of sites displayed on asset maps.
You have to select at least 1 site type to enable Link to a Site Map function and configure asset information for site-dimension maps. If you need to select the site types that are not on the list, contact the system administrator.Site Style
Select the style of sites displayed on asset maps.
If you want to display each site separately, selectAnalog. If you want to display all sites in a certain range by one icon, selectAggregation.Show Site Status
After selecting
Analogas the site style, display color blocks indicating the connection status of the sites under site icons. If you want to modify status names and responding colors, contact the system administrator.Display Data on Aggregation Icons
After selecting
Aggregationas the site style, display specified data on the aggregation icon by selecting Add Data Fields to add a data field and configure the details of the data field such as name, unit, and format.
For example, if you want to display the total electricity generation of the sites in each aggregated area by MWh, select Add Data Fields to add the data field indicating electricity generation from the popup window, and set Name asElectricity Generation, Unit asMWh.Donut Chart
After selecting
Aggregationas the site style, set the aggregated site icons as donut charts and configure the details of data fields displayed on the donut charts.
If you want to display the progress towards a goal or metrics in percentage on aggregated site icons, you can enable this function and configure corresponding data information.Reset Map When Switching Asset Types
Display the default view of the current map when application users switch the asset types of asset maps. You can configure the default view of each map in Configuring Asset Maps.
Link to a Site Map
Open the corresponding site map by selecting the site icon on the global or region map.
For example, after enabling Link to a Site Map for wind sites, application users can open the target wind site map by selecting the icon of the wind site on the global or region map.Configure the following information in the Site section.
Field
Description
Site Link
Enter the URL address of the specified site type.
After enabling Object to Link, application users can open the URL address by selecting the site icon on the asset map.Object to Link
Enable this function, and application users can open the link you entered in the Site Link field by selecting the site icon on the asset map.
Show Object Status
Display color blocks indicating the connection status of the objects in site maps under object icons.
Object Type
Configure the types of objects displayed on site maps. Select Add Object Type and select objects from the dropdown list. If you need to add the objects that are not on the list, contact the system administrator.
More Layers
Add layers to site maps from the dropdown list to display more information about site maps. For more information about the supported layers in each site type, contact the system administrator.
Configuring Canvases and widgets
You can add rich visualized widgets to the Portfolio canvases for the statistics and analysis of asset data to configure customized and visualized monitoring pages.
Configuring Canvases
Select Portfolio from the left navigation pane.
Select the configuration icon
to configure the Portfolio page.Select Canvas Settings tab.
(Optional) In the preview area of the Canvas Settings page, select Add Page to add a new page for the current canvas.
On the left side of the Canvas Settings page, configure the canvases in each asset dimension and for each site type. You can also copy canvas configuration to the current canvas by selecting the format printer button
 and select OK from the popup window.
Adding a Widget
Select Portfolio from the left navigation pane.
Select the configuration icon
to configure the Portfolio page.Select Canvas Settings tab.
In the Widget Library section, hover over the widget you want to add and select Add to add the widget to the current canvas displayed on the preview area.
In the preview area, hovering over the target widget to configure the following information.
Field
Description
Move
Drag the widgets to configure the location of the widget on the canvas.
Change Size
Drag the right bottom corner of the widget to change the widget size.
Edit
Select the edit button
 to open the Edit Widget popup window and edit widget information such as data field and chart style. For more information about editing widgets, see Managing Widgets.
Delect
Select the delete button
 to delete the widget from the current canvas.
Managing Widgets
Select Portfolio from the left navigation pane.
Select the configuration icon
to configure the Portfolio page.Select Canvas Settings, hover over the target widget on the canvas from the preview area and select the edit button
.Enter the following information in the Basic Information Section.
Field
Description
Title
Enter the title of the widget.
Description
Enter the description of the widget.
Show Title
Display the widget title in the top left corner of the widget.
Trend Analysis
Enable this function, and application users can analyze the trend of widget data in a popup window by hovering over the widget data and selecting Trend Analysis.
Pop-up Color
After enabling Trend Analysis, select the color of the popup window for trend analysis as
Bluish GreenorDark.Select Add Data Fields in the Data Field section, select the data fields you want to add to the widget from the popup window and select OK.
Select the tags of the added data fields to expand the configuration section and enter the following information.
Field
Description
Name
Enter the name of the data field displayed on the widget.
Unit
Enter the unit of the data field.
Convert Unit
Automatically adjust the unit of data fields based on data value, supporting units such as KW, MW, and KWh. For more information, contact the system administrator.
Decimal Places
Select the decimal places of data fields displayed on the widget.
Show Thousands Separator
Separate every 3 digits by commas (,).
Asset Dimension Aggregation
Select the calculation method to aggregate the asset data under the same dimension, supporting methods such as sum and average.
(Optional) Repeat step 3 and 4 to add multiple data fields. You can sort the order of data fields by drag the sort icon on the left of each data field tag.
Configure the style and time settings of widgets in the Chart Style and Time Settings sections. For more information about the style and time settings of each widget, see Widget Reference.
Publishing a Portfolio Page
After finishing the configuration of the Portfolio page, you need to publish the page by the following steps to enable application users to view the pages and use the functions you configured:
Select Portfolio from the left navigation pane.
Select the configuration icon
to configure the Portfolio page.(Optional) Select Preview to open a preview page of the Portfolio to check the functions and configuration of the page.
Select the Publish tab and select the Publish button.
In the popup window, enter the description on the Remark text box.
Select OK.
Restoring History Versions
You can view the information of previous versions such as the version number, the application creator who published the version, and the publishing time of the version. If you want to use the previous version of the Portfolio page, restore a history version of the Portfolio page by the following steps:
Select Portfolio from the left navigation pane.
Select the configuration icon
to configure the Portfolio page.Select History Version to open the history version list.
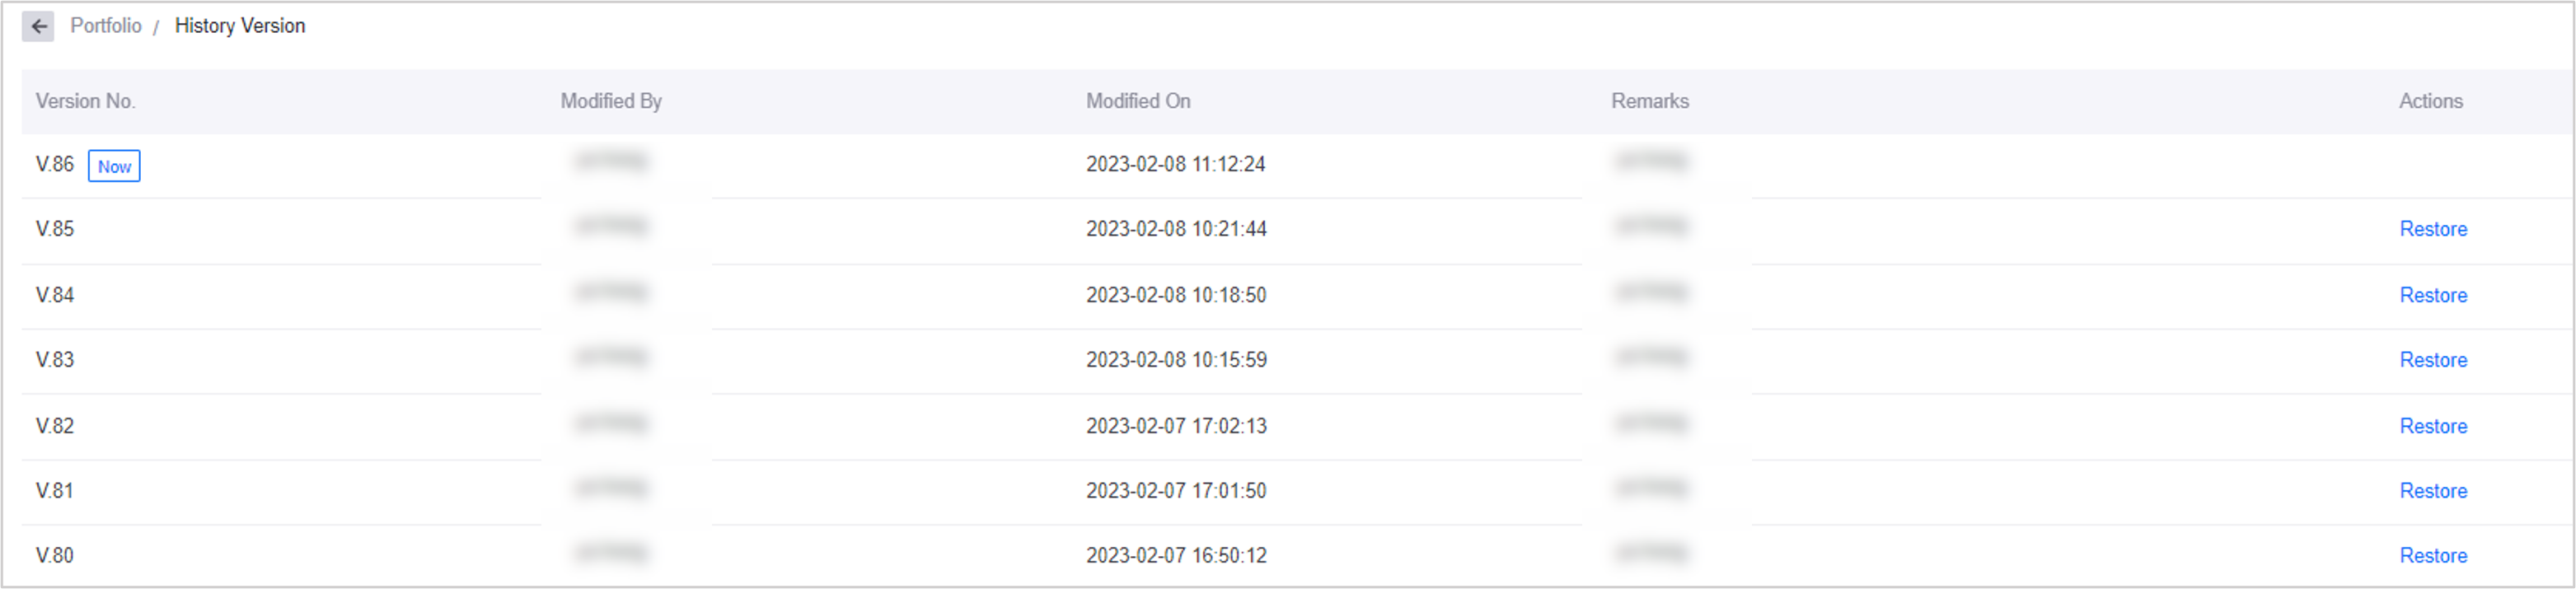
Locate the target history version and select Restore.
Select OK in the popup window.
Note
You can view or restore the last 100 history versions on the history version list.
Exporting and Importing Page Configuration
You can export the current configuration of the Portfolio page in JSON format and import the JSON file to reuse the configured Portfolio page.
Exporting Page Configuration
Select Portfolio from the left navigation pane.
Select the configuration icon
to configure the Portfolio page.Select Import/Export > Export, and the configuration file will be downloaded automatically.
Importing Page Configuration
Select Portfolio from the left navigation pane.
Select the configuration icon
to configure the Portfolio page.Select Import/Export > Import.
In the popup window, select Upload to upload the exported JSON file.
Select OK.
Configuring URL Parameters
Besides the configuration above, application creators can enable or disable more functions by configuring the parameters of the URL. For more information, see URL Parameters.