Repurposing Widgets
You can repurpose widgets by changing the data fields or chart types.
Replacing Data Fields
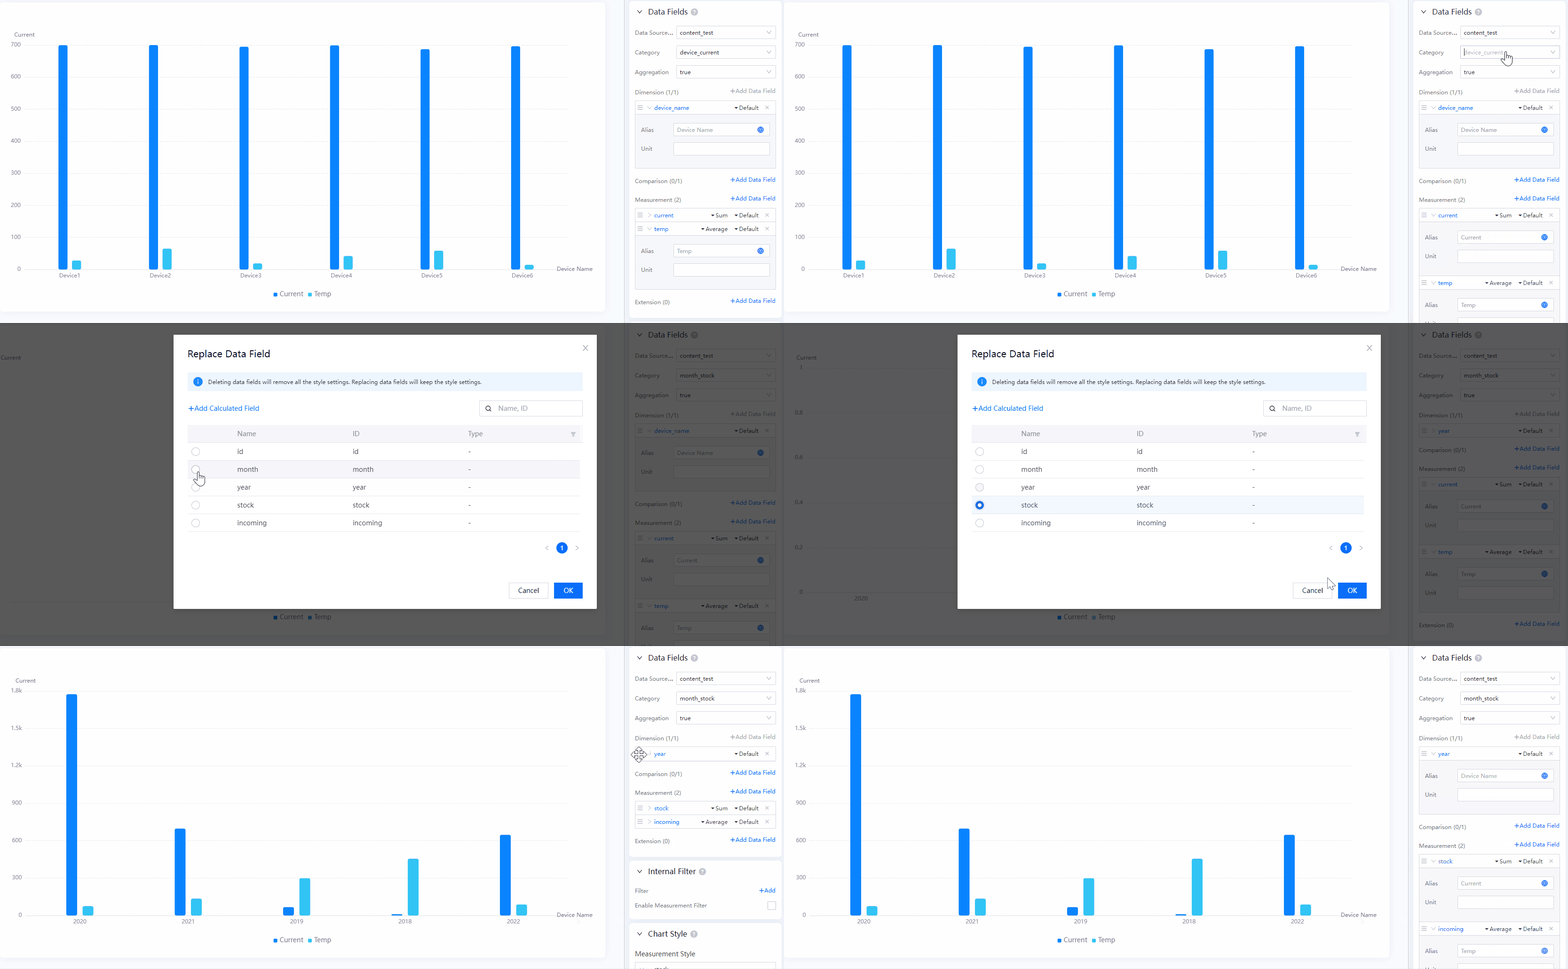
When you create new charts from a template or edit an existing chart, to retain the original configured chart settings, you can replace the data fields. The original settings in Basic Information, Internal Filter, Chart style, Other Settings and Conditional Formatting will be retained.
Replace a data field by following these steps:
Select the Data tab in the Chart Settings panel.
Select a new data source or category.
In the confirmation dialog box, select OK.
Go to the Dimension, Measurement, or Comparison sections, and select a data field. The Replace Data Field dialog box appears.
Select the new data field that you want to use and select OK.
Note
Alternatively, you can select X to remove all configured data fields and reconfigure them from scratch.

Changing Chart Type
You can change the chart type while retaining the configured data fields if the type and number of data fields configured in the new chart type are the same or more than your current chart. Otherwise, all data fields and chart styles will be reset.
For example:
If you change a chart type that contains 1 dimension and 2 measurements to a chart type that supports 1 dimension and 6 measurements, the configured data fields will be retained.
If you change a chart type that contains 1 dimension and 6 measurements to a chart type that supports 1 dimension and 1 measurement, the configured data fields will be reset.