Unit 5: Monitoring Device from Cloud
After the device is connected and starts to upload data to EnOS Cloud, you can monitor the device from the cloud.
Checking the Device Status
In the EnOS Management Console, click Asset Management > Device Asset。
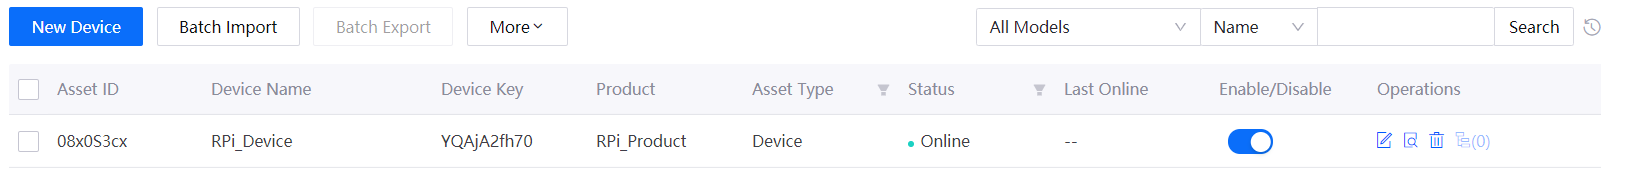
Find the RPi_Device from the device list.
Check the status of the device. The status of the devices will now be Online.
Viewing the Uploaded Data
You can view the device data that was uploaded to EnOS Cloud in the EnOS Management Console.
Click
 to open the Device Details page, and click the Measurement Points tab.
Locate the Temperature measurement point, and click
to view the measurement point real-time data on the Data Insights page.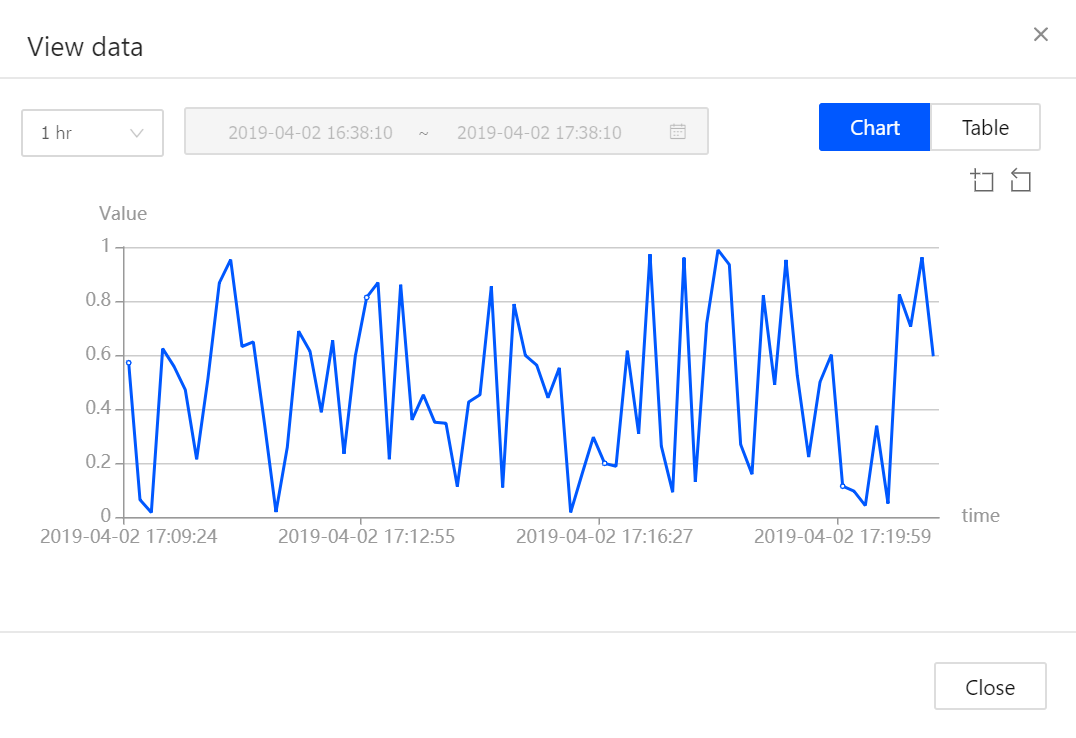
The storage policy can be configured to store the uploaded device data for further processing and analysis. For more information, see Managing Time Series Data.
Viewing the Alert Records
In the EnOS Management Console, select Alert > Alert Record.
Search for active alerts and history alerts reported for the RPi using its asset ID or model ID.
Alternatively, you can configure alert subscription topics for the alerts, so that any alerts reported will be pushed to your application. For details, see the Subscribing to Device Real-time Data and Alert Records tutorial.