Monitoring APIs
For published APIs, users can view their basic information and the invoking status at API Monitor.
Before You Start
Ensure that you have an EnOS account and the permissions to create APIs in the EnOS Management Console. For more information, see Policies, Roles, and Permissions.
Ensure that you have completed the Creating APIs and Deploying APIs tasks.
API Log
You can click the Log icon for the API to see its call Log. For more details, see API Logs.
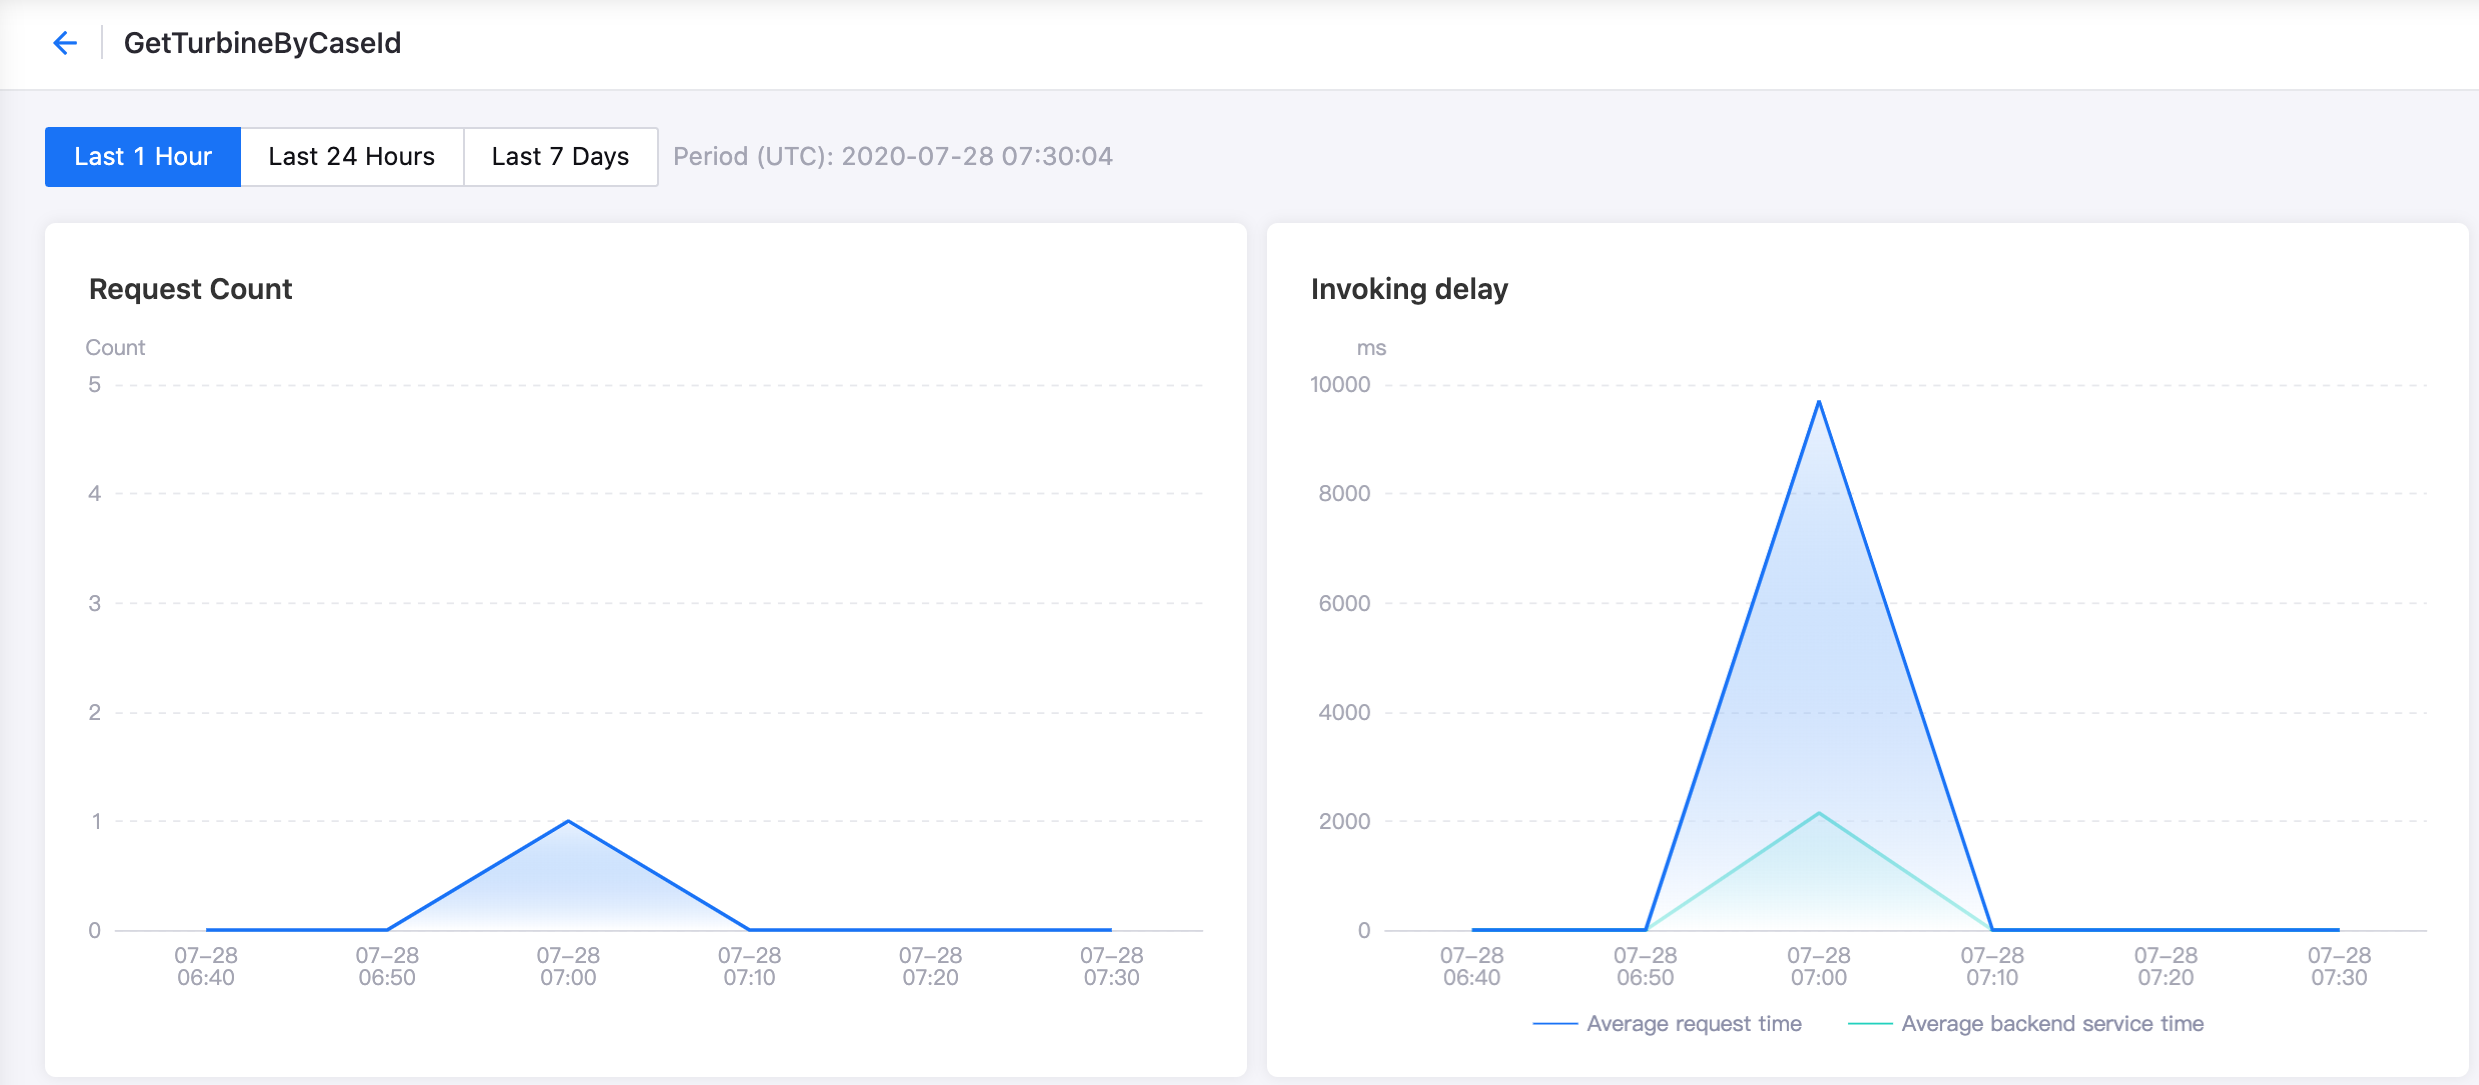
API Statistics
In the EnOS Management Console, select API Management > API Monitoring, and click the Statistics button of the API to view the request number and the invoking delay for the past hour, the past 24 hours, and the past 7 days.
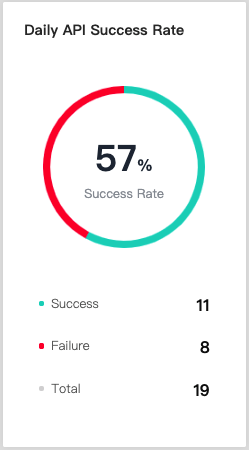
API Health
Click the Health button of the API to view the number and success rate of invoking for the past 24 hours.
Viewing the API Daily Success Rate
You can view the daily success rate of the API calls, the number of successful and failed calls, and the total number of calls on the left of API Health.
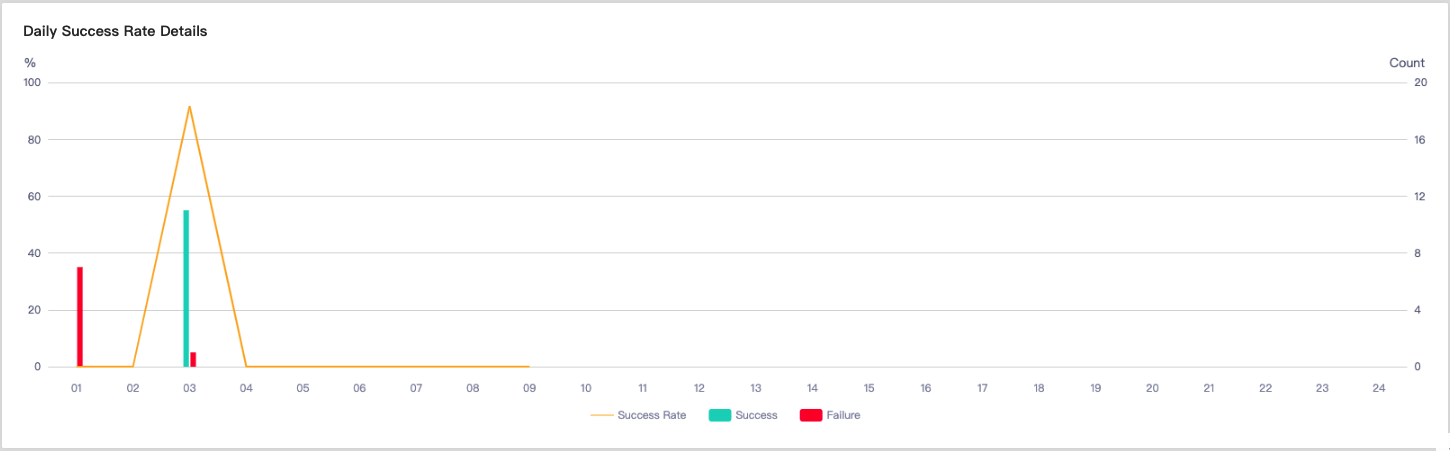
Viewing the Details of the API Daily Success Rate
You can view the number of successful calls, the number of failed calls, and the success rate of each hour from the chart of Daily Success Rate Details in API Health.
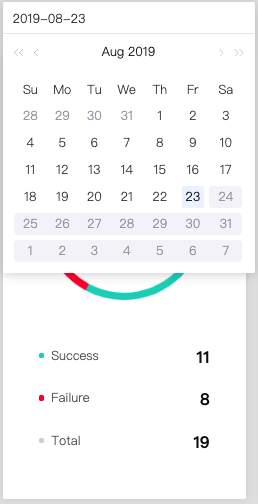
Viewing the Invoking Data History
You can select a date from the drop-down list and view the information for that date.