Viewing Cloud Flow Logs
There are two types of logs that you can view for a cloud flow: flow logs and node logs.
Before You Start
Ensure that the flow is currently running or was running previously.
Ensure that the Debug switch was toggled on for the flow when it was published.
Flow Logs
Flow logs are logs for the flow itself. Flow logs are stored for a maximum period of 15 days.
In the EnOS Management Console, go to Device Integration > Flow Designer.
In the list of cloud flows in the Flow Designer page, find the one you wish to view its logs for and click Edit.
Click the Log icon at the top of the page and the Log section will appear at the bottom of the screen.
Select a date range and the status (Success, Error, or All for both success and error). Additionally, you can further customise your search by entering a keyword. If the keyword is found in the input msg of the first node of the flow, the search results will return the relevant logs.
Click Search.
The results, if any, will be displayed below.
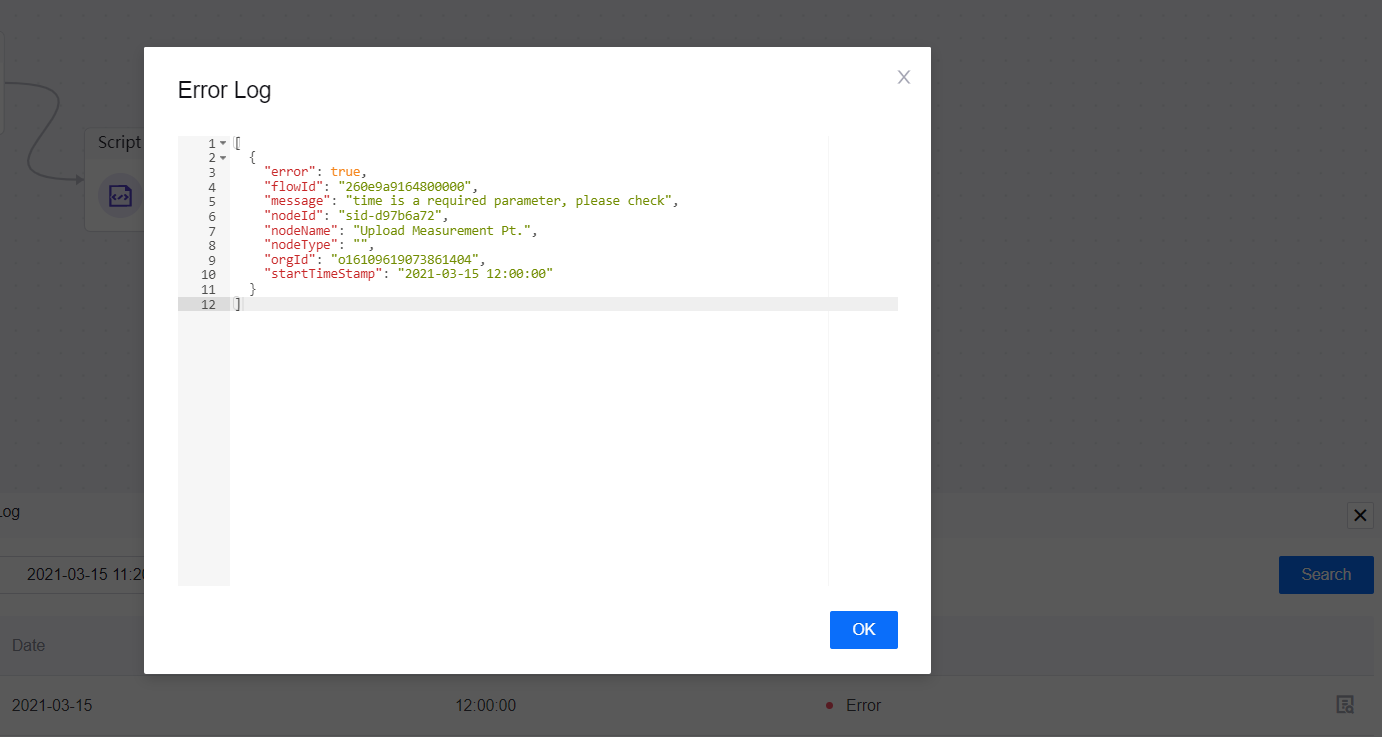
For logs with an Error status, you can click its corresponding Error Details icon to view the error log.
Node Logs
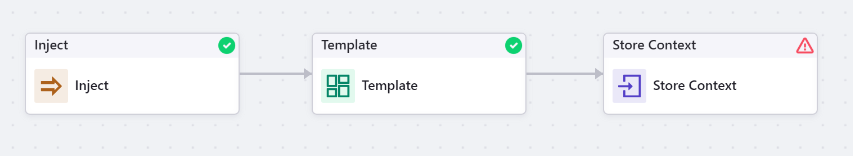
You can see each node’s status on the canvas page at a glance: nodes without errors have a green icon displayed at the top right of the node while nodes with errors have a red icon.
You can access node logs by clicking on the node. Note that some nodes do not have logs. Node logs are stored for a maximum period of 7 days.
In the EnOS Management Console, go to Device Integration > Flow Designer.
In the list of cloud flows in the Flow Designer page, find the one you wish to view its nodes logs for and click Edit.
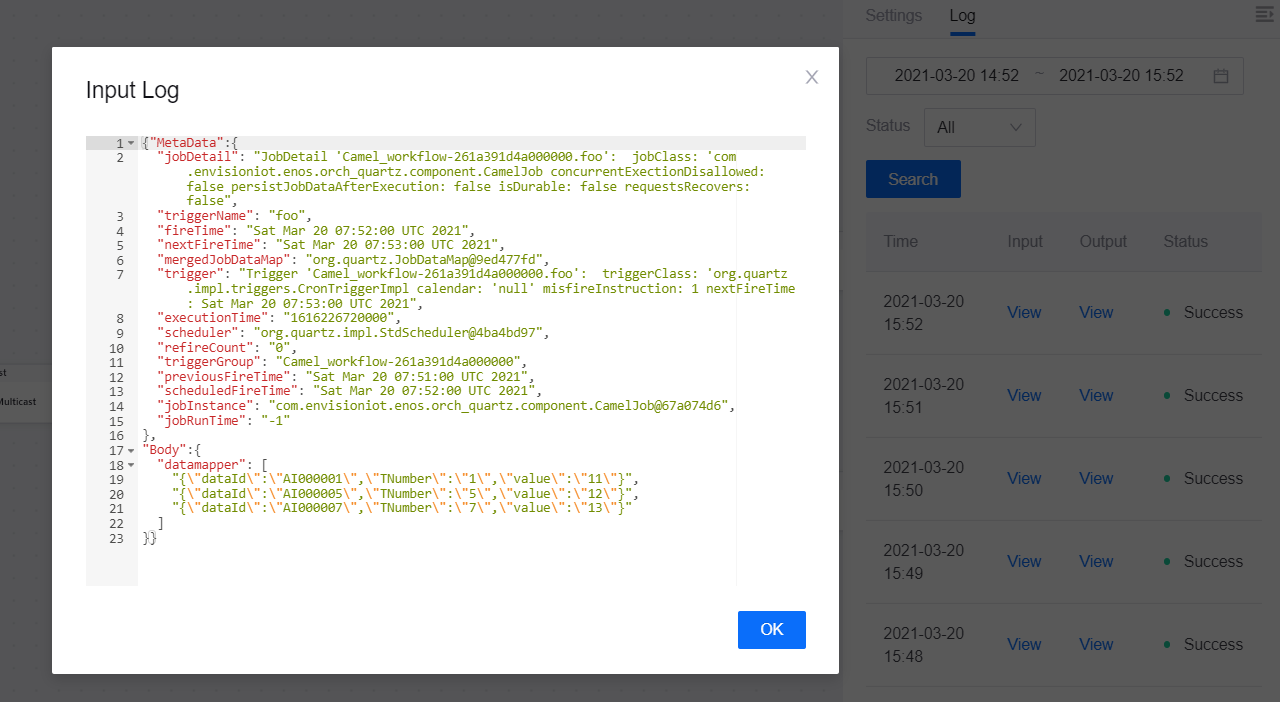
Click the node you wish to view the log of and click its Log tab.
Select a date range, the status (Success, Error, Stopped, or All for all three statuses), and click Search.
The results, if any, will be displayed below.
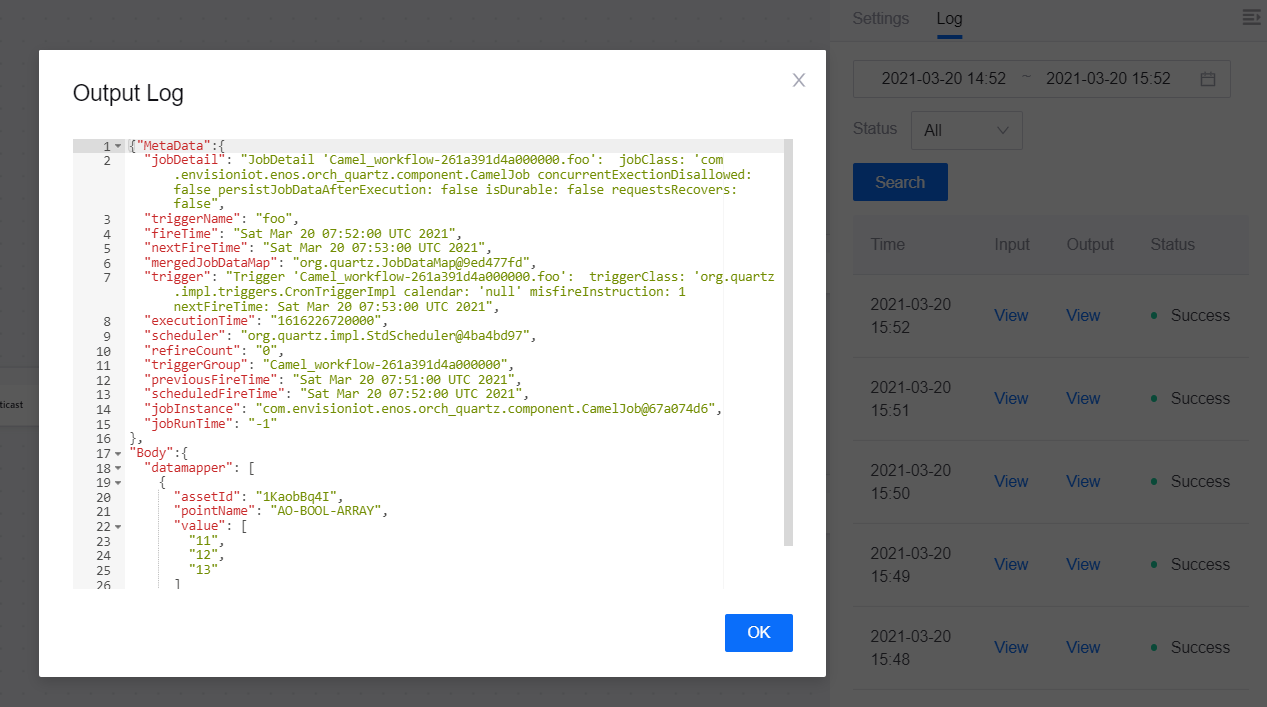
For node logs, you can click View under Input or Output to view the node’s input and output msg respectively, as well as its metadata.