Dashboards
The dashboards in “Monitoring & Operations” provides you with an easy to read summary of the device status, behaviours, and connections, including Device Monitoring Dashboard, DC Dashboard, and Custom Dashboard. These dashboards allow you to monitor the real-time status of your devices and connections for your products. Additionally, you can view charts pinned from the Metrics Exploration feature and added to your custom dashboard
Prerequisite
You need to be assigned the Device Management Administrator policy. If you are not assigned, contact your OU administrator. For more information about policies in EnOS, see Policies, Roles, and Permissions.
Viewing Device Status
To view the status of your devices in the EnOS platform, follow these steps:
In the EnOS Management Console, go to Monitoring & Operations > Dashboard and click one dashboard. By default, dashboards display the device status for all products within the last hour.
To switch between chart types, click on the Chart button
 on the right side of the chart.
You can hover your mouse over the chart to view specific data points.
Device Monitoring Dashboard
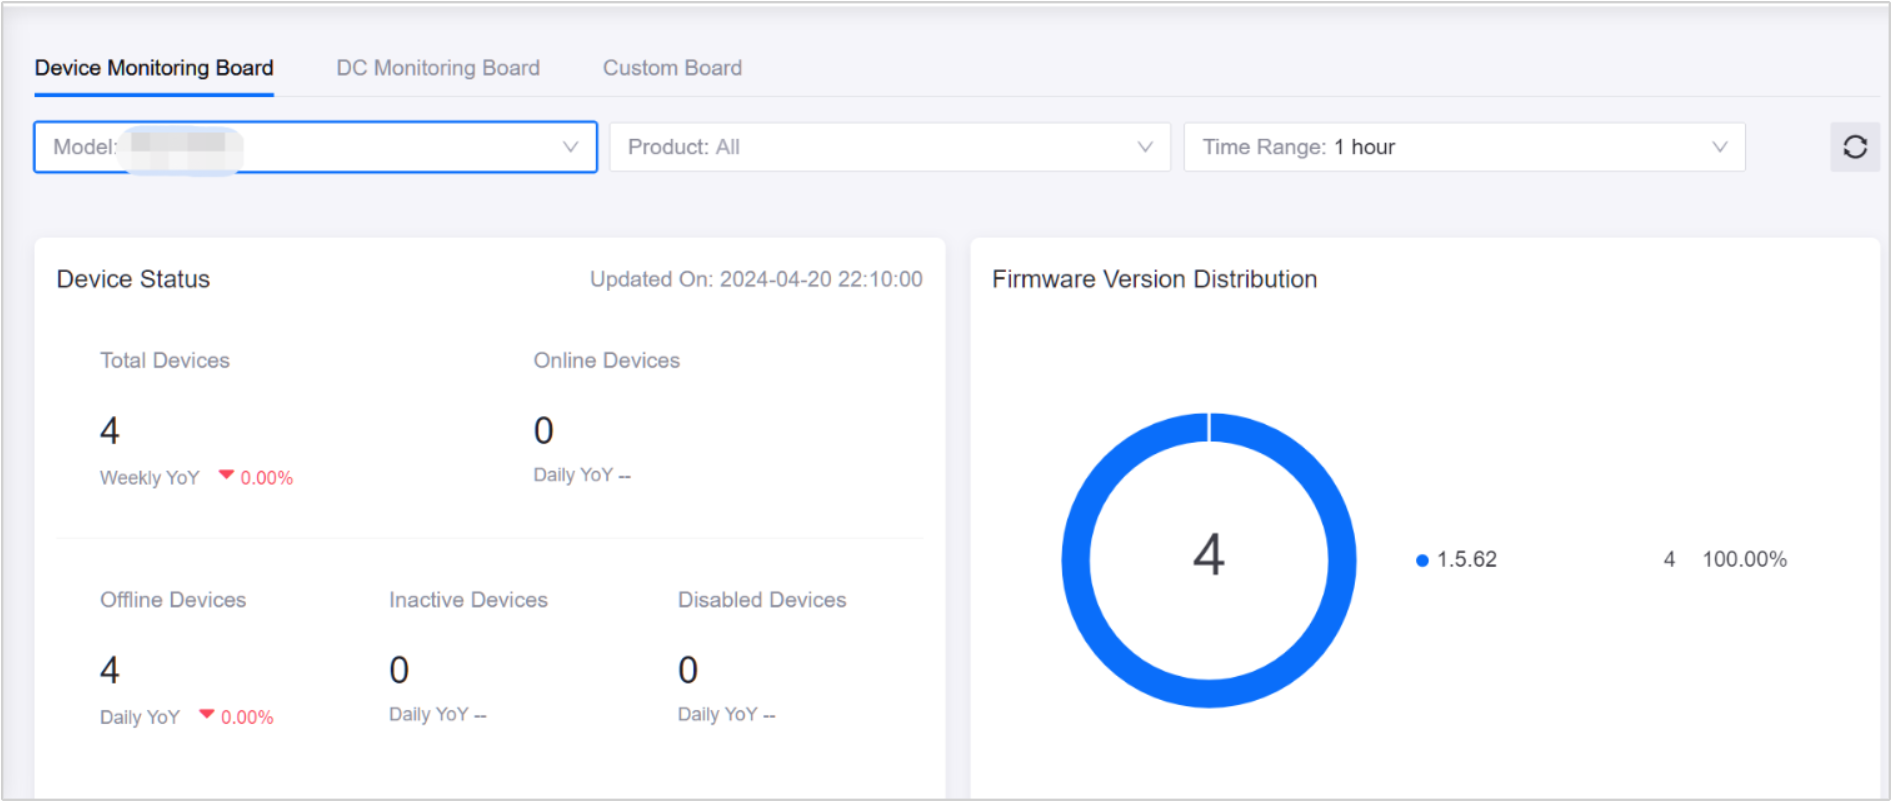
Go to the Device Monitoring Dashboard. In this dashboard, you can view various device management information, including device status, point reporting, command issuance, point reporting trends, firmware version distribution, device status trends, and command issuance trends
Select a specific model or product from the Model or Product dropdown list and change the Time Range to view device status for the past 1 day, 7 days, or 30 days. Data will be refreshed every minute.
Click the Refresh button to retrieve the latest results.

DC Monitoring Dashboard
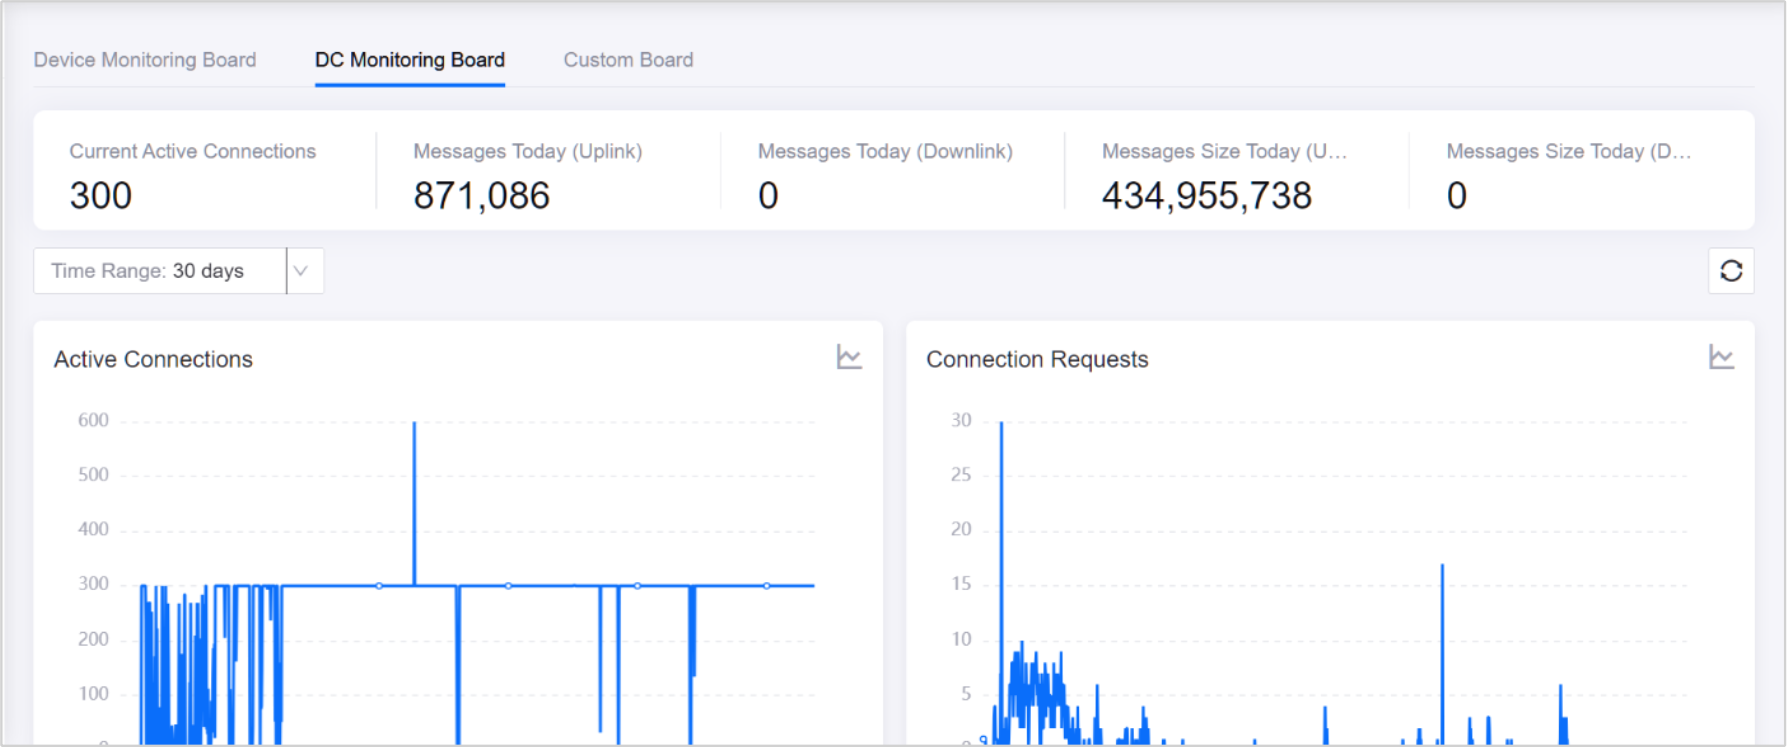
Go to the Device Connectivity Dashboard. In this dashboard, you can monitor device connection status, message uplink and downlink status, and other device connectivity information
Change the Time to view device status for the past 1 day, 7 days, or 30 days. The refresh rate is set to every minute.
Click the Refresh button to retrieve the latest results.

Custom Dashboard
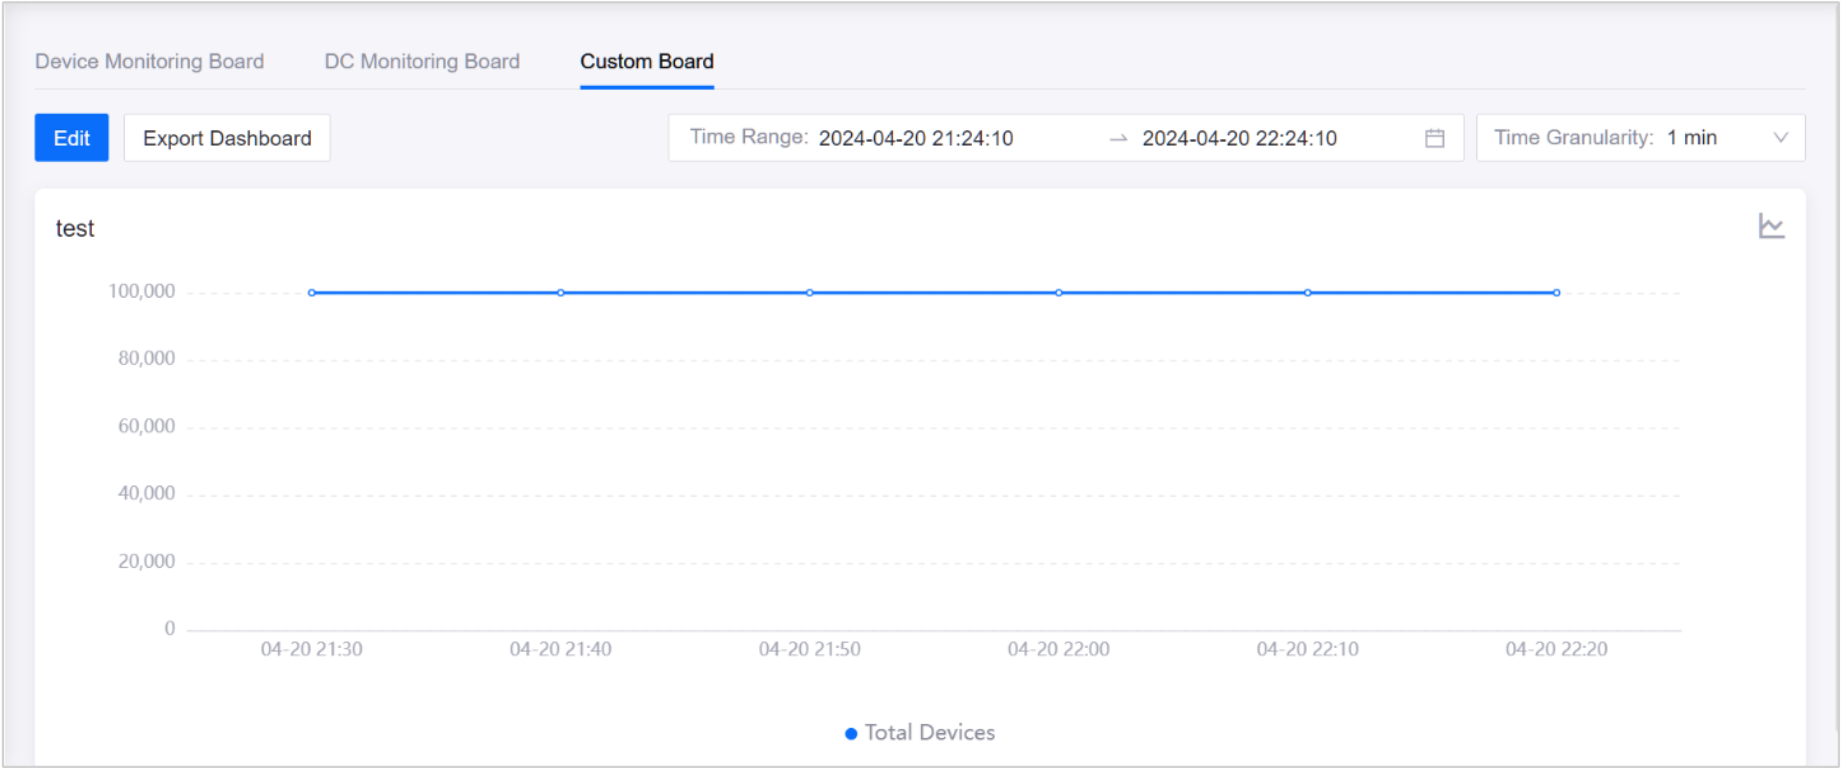
Go to Monitoring & Operations > Dashboard > Custom Dashboard. In this dashboard, you can view charts pinned from the “Metrics Explorer”. For more information about the procedures of customizing dashboards, see Metric Explorer.
By default, the charts are set to display data for the last hour. You can configure the Time Range and Time Granularity from the dropdown list.
To edit or export the dashboard, click the Edit or Export Dashboard button in the top-left corner.
