Deploying and Previewing Graph
After completing the configuration of the graph page, you can export the graph as an .SVG file and deploy it on the web server.
Prerequisites
Before deploying the graph to the Web server, ensure that the service account (SA) of the application built with EnOS HMI has been authorized to access the asset data. Otherwise, the bound dynamic data cannot be displayed on the preview page. For more information about authorizing the SA account, see Managing Service Accounts.
Procedure
Select File > Export SVG … from the menu.
Export the graph as an .SVG file and save it in your local directory.
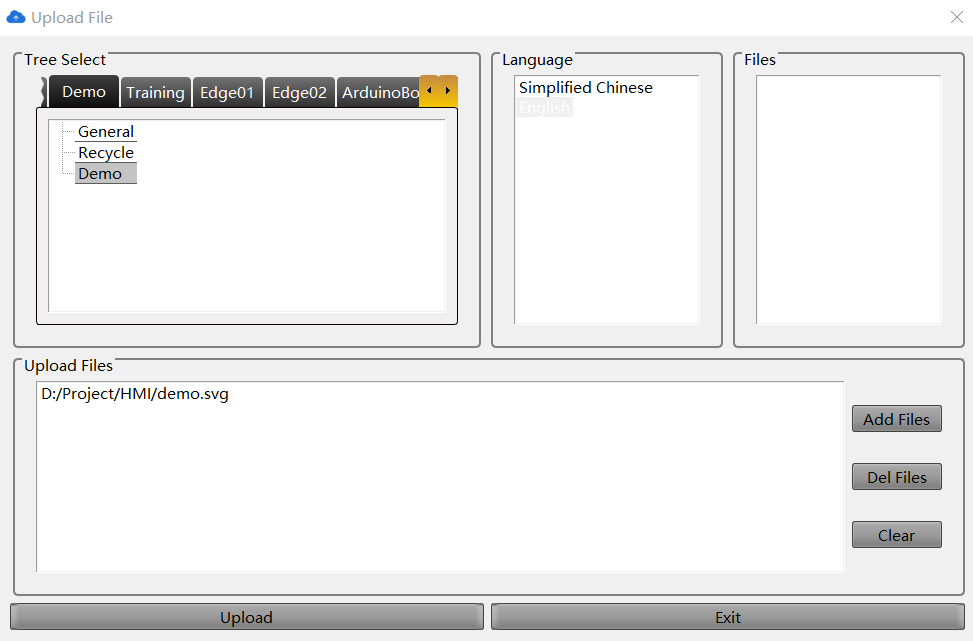
Select File > Upload SVG from the menu.
In the Upload File window, select the directory to save the deployed file. Note that if an asset tree or asset has the
type=HMItag, the graph file cannot be stored under the asset name directory. This asset can be considered as a “site” or “plant”.Select the language of the deployment environment.
Click Add Files, browse and select the .SVG file to be uploaded, and click Upload.
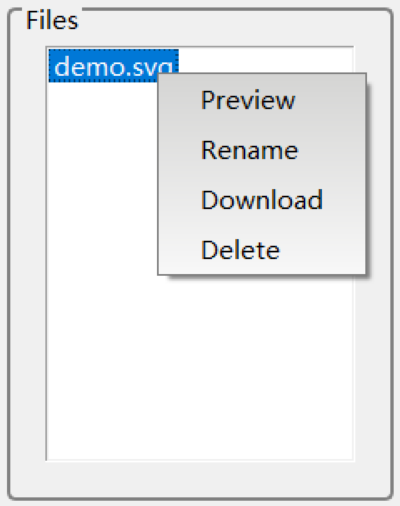
The uploaded .SVG file will be displayed in the Files section. Right-click the uploaded .SVG file, and select Preview.
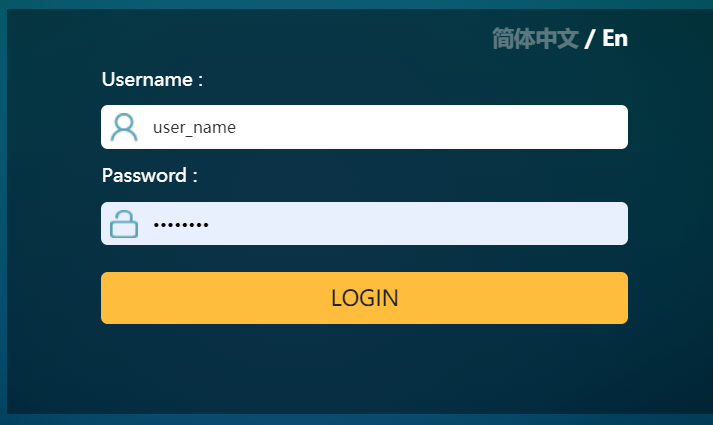
In the browser window, enter your EnOS account and password to log in to the web page to preview the deployed data monitoring page.
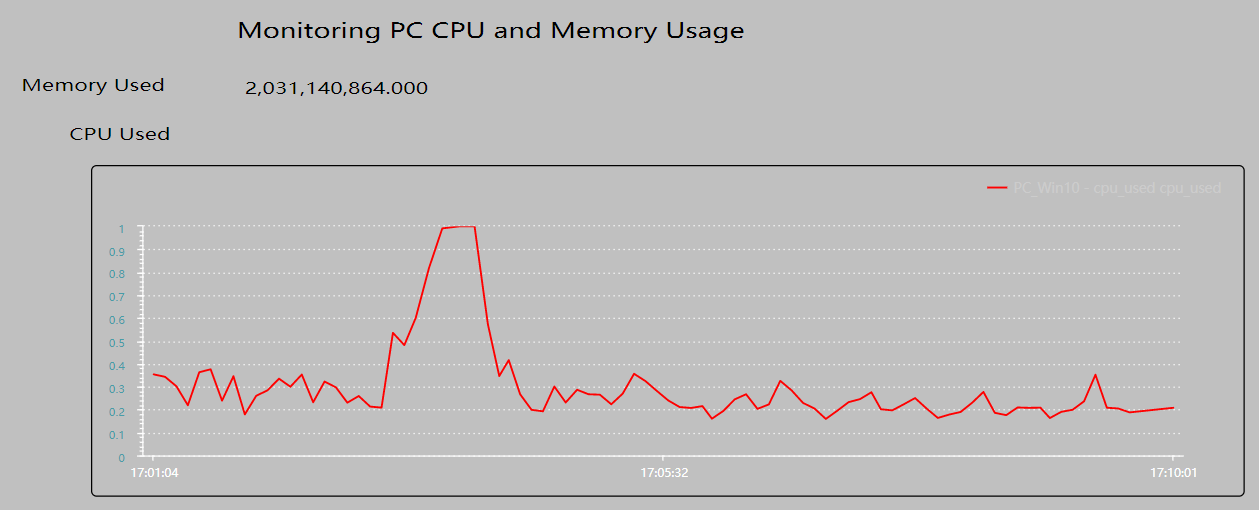
Check the layout of the deployed page and displayed asset data.
10. If you need to further edit the page, just update the graph file, export it as an .SVG file, and deploy it to the web server again.