Progress Bar
The progress bar element is usually used to display and monitor the progress percentage of asset data.
Follow the steps below to insert the progress bar element in the graph area.
From the Base Icon Tool navigation bar, select the Progress Bar element, move the cursor to the graph area, and left-click the mouse.
Move the mouse to draw the progress bar and left-click the mouse.
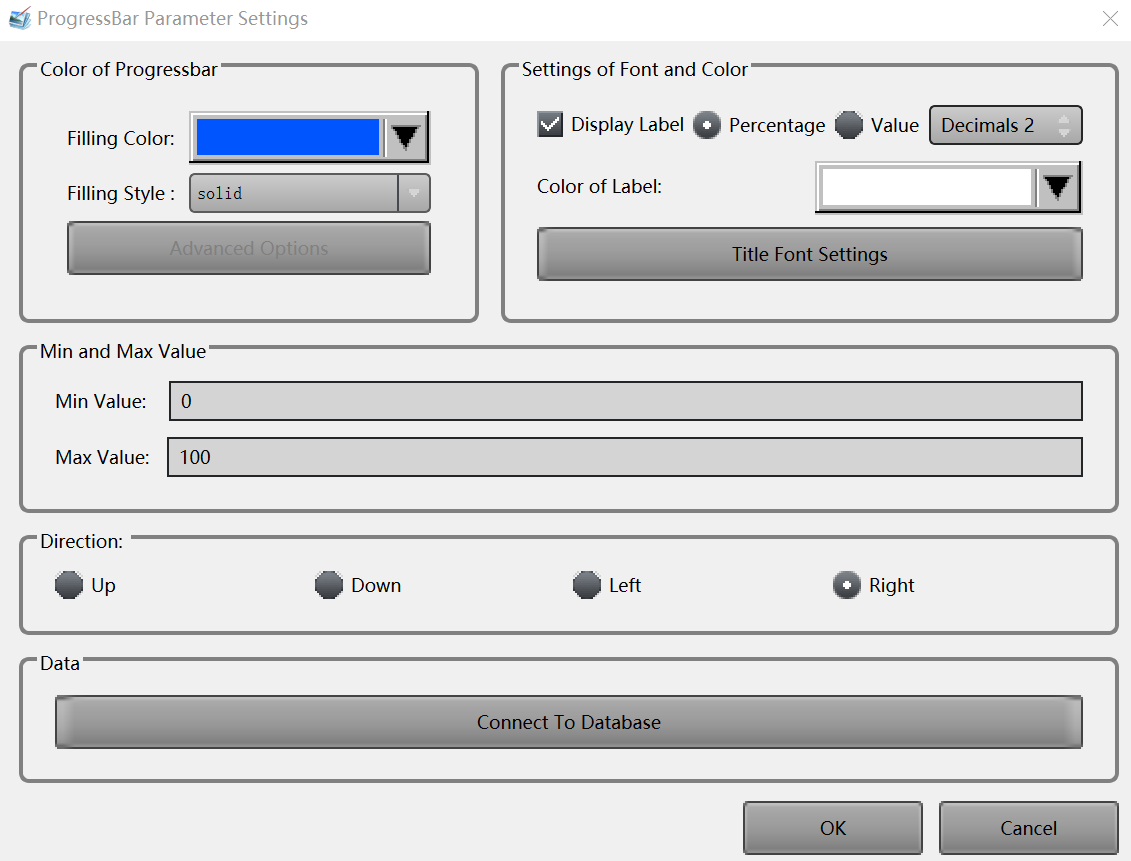
Set the properties of the progress bar in the Progress Bar Parameter Settings pop-up window.
Select the filling color and filling style of the progress bar.
Select whether to display the label and the color and font of the label.
Enter the min and max values of the progress bar.
Select the direction of the progress bar.
Click the Connect To Database button to select the asset measurement point to be associated with this progress bar.
Click OK to save the setting of the progress bar.
To further edit the properties of the progress bar element, double-click the element in the graph area, and make your changes in the pop-up window.
Repeat the steps above to insert and edit other progress bar elements in the graph area.