Curve
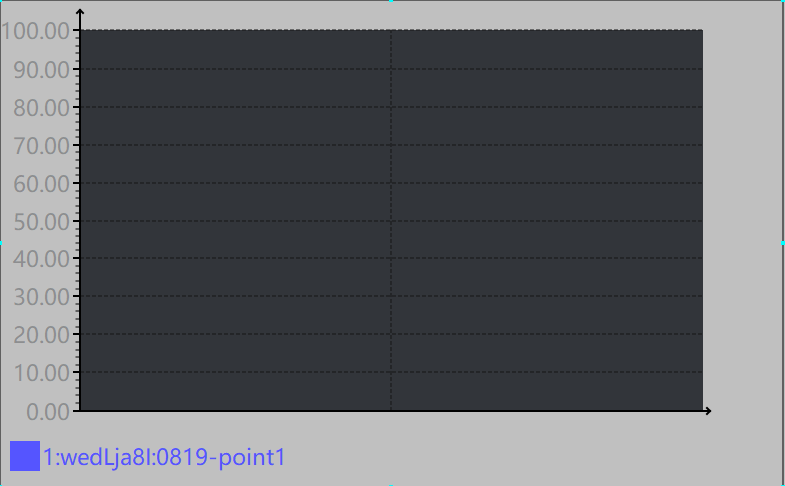
The curve element is usually used to display and monitor continuously changing asset data and the data changing trend.
Note
Before using the curve element to monitor asset data, you must configure the storage policy for the asset measurement point on the EnOS Management Console. For more information, see Configuring TSDB Storage.
Follow the steps below to insert the curve element in the graph area.
From the Base Icon Tool navigation bar, select the Curve element, move the cursor to the graph area, and left-click the mouse.
Set the properties of the curve in the Curve Tool Parameter Settings pop-up window.
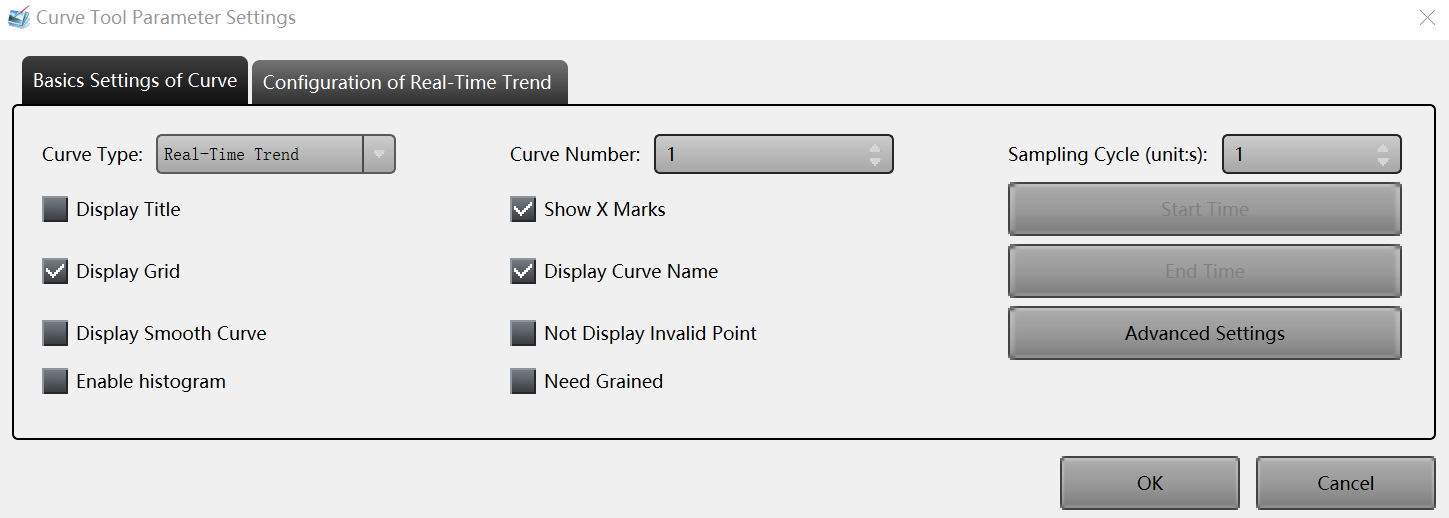
Complete the basic configuration for the curve element under the Basic Settings of Curve tab.
Curve Type: Select the type of the curve (Real-Time Trend, Sample/Plan Trend, XY Curve, or XY Power Curve).
Curve Number: Number of inserted curves.
Sampling Cycle: Select or enter the time interval of data sampling.
Complete other settings based on the business needs.
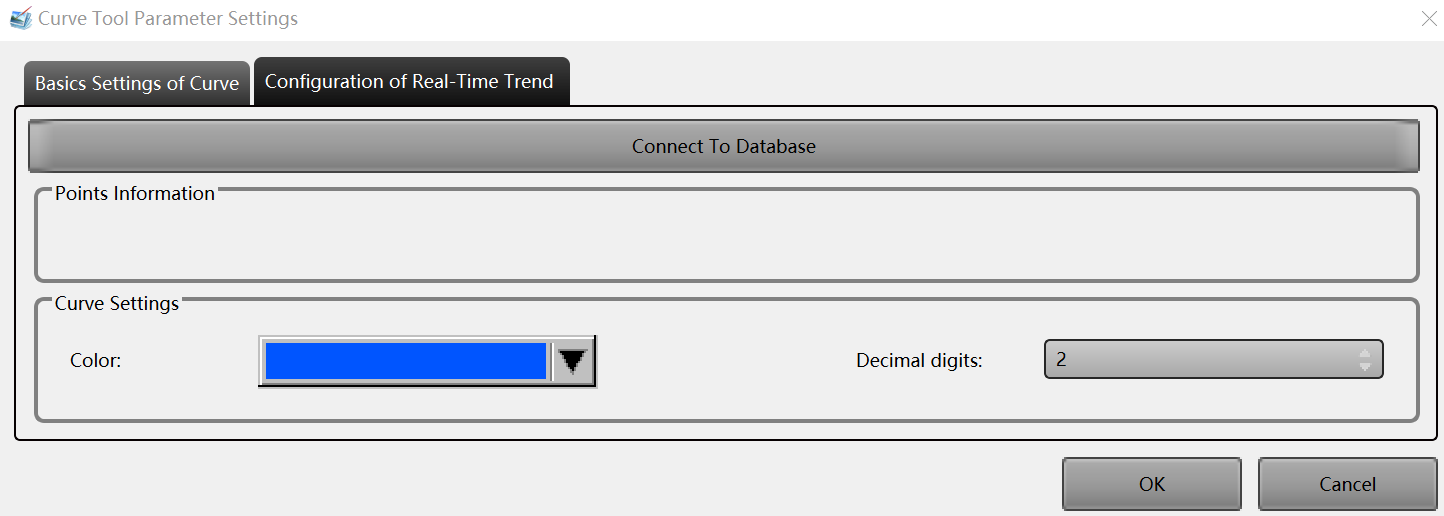
Based on the selected curve type, configure the parameters of the curve under the Configuration tab (taking the Real-Time Trend curve as example).
Click the Connect To Database button to select the asset measurement point to be associated.
Select the color for the curve.
Select or enter the number of decimal places.
Click OK to save the settings of the curve element.
To further edit the properties of the curve element, double-click the element in the graph area, and make your changes in the pop-up window.
Repeat the steps above to insert and edit other curve elements in the graph area.