Unit 5. Run the Pipeline and View Pipeline Running Results
Run the Pipeline
In this tutorial, you need to run the pipeline twice to perform training tasks and prediction tasks. To run the pipeline:
After saving the pipeline, select the Run icon in the functional operation area.
Enter
trainingas tasktype, and select OK to start training tasks.After the model training completes, select the Run icon and change the tasktype value to
prediction.Enter
serviceorfileas predictiontype to specify the prediction type.If you enter
serviceas predictiontype, the pipeline will make predictions based on published model services.If you enter
fileas predictiontype, the pipeline will make predictions based on Mlflow model files.
Specify the value of HDFS_source and hive_source to save the prediction results to HDFS and EnOS Hive.
Select OK to start prediction tasks.
View Pipeline Running Status and Prediction Results
During the pipeline running, you can view the pipeline running status by the following steps:
Select Run Instances to view the instance list.
Select the instance name of prediction tasks.
View the running results on DAG Graph, Detail, and Gantt tabs.
On the DAG Graph tab, you can view the running results of running instance, including the running progress, input and output parameters, current running logs, and Pod information of operators.
On the Detail tab, you can view the details, running parameters, and advanced configuration of the running instance.
On the Gantt tab, you can view the running status distribution diagram of each operator and the running progress.
After the pipeline is run successfully, you can view the operator outputs under the DAG Graph tab:
If the predictiontype value is
service, select the Write results operator to view the input/output parameter information.If the predictiontype value is
file, select the Write results 2 operator to view the input/output parameter information.
To view the prediction results:
Select Create DataSet icon
 to create a dataset based on the output and analyze the data. For more information, see Dataset Management.
Select Copy icon
 , and then open a Notebook instance in AI Lab, open a new document to run the pasted code.
If the prediction results are saved to EnOS Hive, you can visualize the prediction results using EnOS Digital Twin Visualization (DTV).
(Optional) Visualize the Prediction Results in DTV
The EnOS DTV service provides enterprises data visualization solutions. You can use DTV to visualize the prediction results if:
You are able to access the Data Federation module in the EnOS Management Console and the DTV in the EnOS Application Portal.
Your OU has requested for EnOS Hive and Data Federation resources.
For more information, see Digital Twin Visualization.
Create a Data Federation Channel
Create a Data Federation channel to send the pipeline data to DTV:
Log in to the EnOS Management Console and select EnOS Data Management - Data Governance > Data Federation > Federation Channels.
Select New Channel, enter
wind_demoas Name, then provide the following information in the popup window:Attribute
Value
Data Source > Add Data Source > Type
HIVE (EnOS)
Data Source > Add Data Source > Data Source
HIVE (EnOS)
Data Source > Add Data Source > Alias
hive_enos
Data Source > Add Data Source > Execution Queue
root.eaptest01
Select Save and Next.
In the application list, select the Authorize/Revoke toggle button on the right side of the DTViz application to authorize permission for this application.
Select Finish and note the channel ID.
Connect the Data with DTV
Create a DTV Data Source to receive the pipeline data:
Log in to DTV in the EnOS Application Portal, select Dashboards > Data Source on the left navigation pane.
On the External Data Sources tab, select New Data Source and provide the following information in the popup window:
Attribute
Value
Type
Data Federation
Name
wind_demo
ChannelId
ID of the data federation channel just created
Select OK.
Create a Project and a Page in DTV
Create a new project and a new page in DTV:
Select Dashboard on the left navigation pane, and the project page opens.
select New Project and enter
Power Forecastingas Name in the popup window.Select OK, and the project creates.
Select New Page and provide the following information.
Name: Wind
Project: Power Forecasting
Select OK, and the page editor opens.
Create a Widget in DTV
Create a DTV widget to visualize the prediction results:
On the page editor, select Add icon
 on the toolbar to open the dropdown menu and select Widget (New).
Select the Advanced Mode toggle button on the right side of the top toolbar to enable more widget editing functions.
From the Chart Type section, select Mix Chart
 .
.Enter
Wind Power Forecastas Title in the Basic Information section.In the Data Fields section, provide the following information:
Attribute
Value
Data Source
wind_demo
Category
Power Prediction
Aggregation
Raw Data
Dimension
x_basic_time
Measurement
r_speed, f_power, r_power, f_speed
In the Measurement Style section, provide the following information:
Attribute
Dual Y-axis
Chart Type
r_speed
Enable
Line
f_speed
Enable
Line
r_power
Disable
Area
f_power
Disable
Area
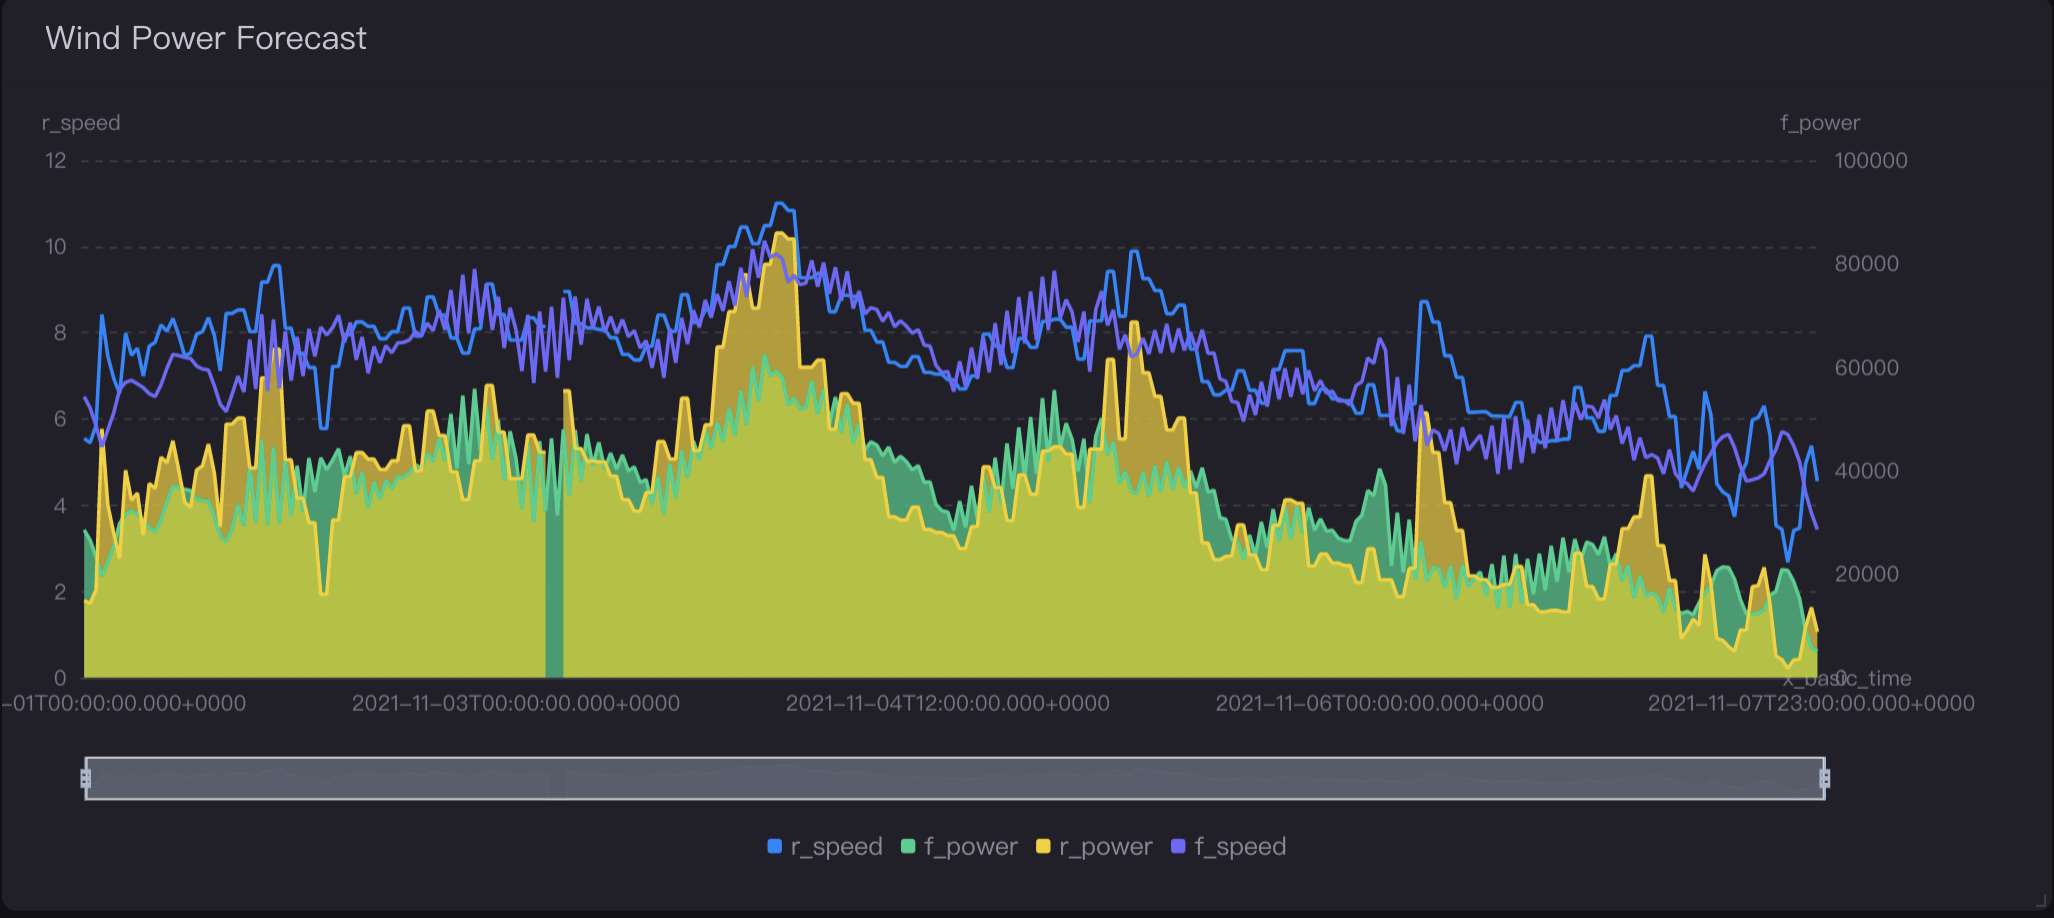
Select Save. You can now view the predicted values and actual values in the chart.
An example of the Wind Power Forecast widget: