Explore Datasets
The exploration and analysis functions provided by Dataset Management are mainly for exploring Tabular type datasets (with time series characteristics) through different dimensions. The dataset exploration and analysis functions mainly include the following methods:
Dataset preview
Statistical analysis
Chart analysis
The dataset exploration and analysis functions provide common and basic exploration only to facilitate rapid exploration of datasets. If the above methods cannot meet the needs of dataset exploration and analysis, you can also use Python code to explore and analyze datasets in AI.
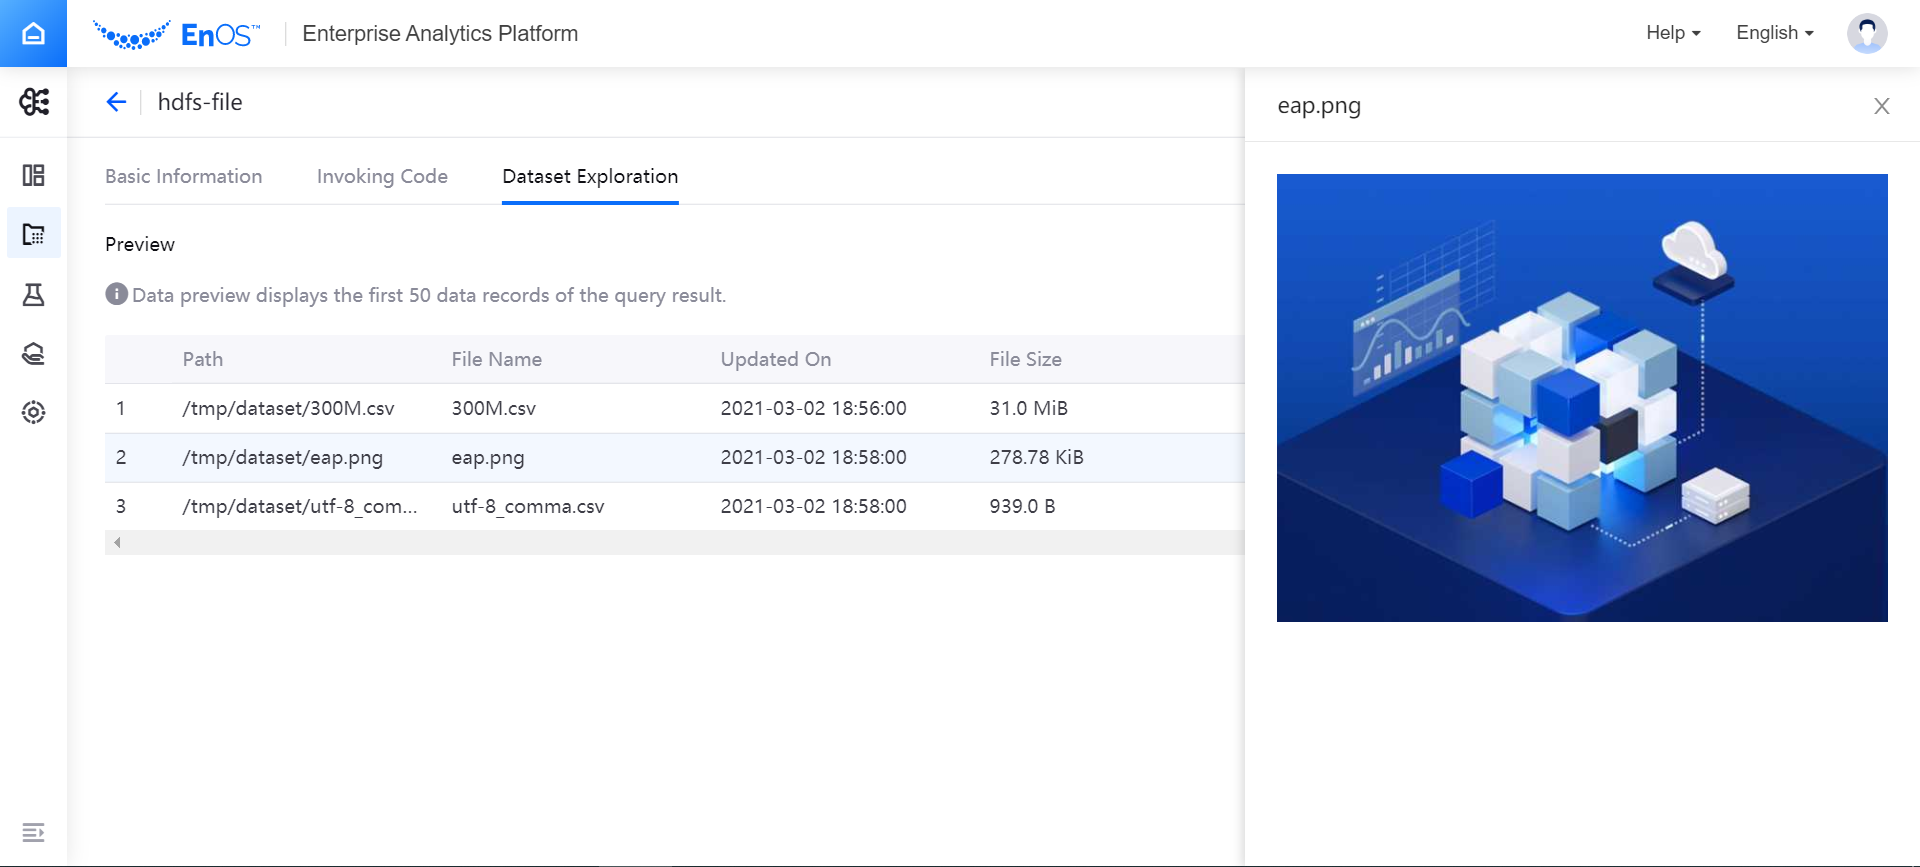
For File type datasets, the exploration and analysis functions support dataset preview only, displaying information such as file path, file names, update time, file size, and file extension.
Preview Datasets
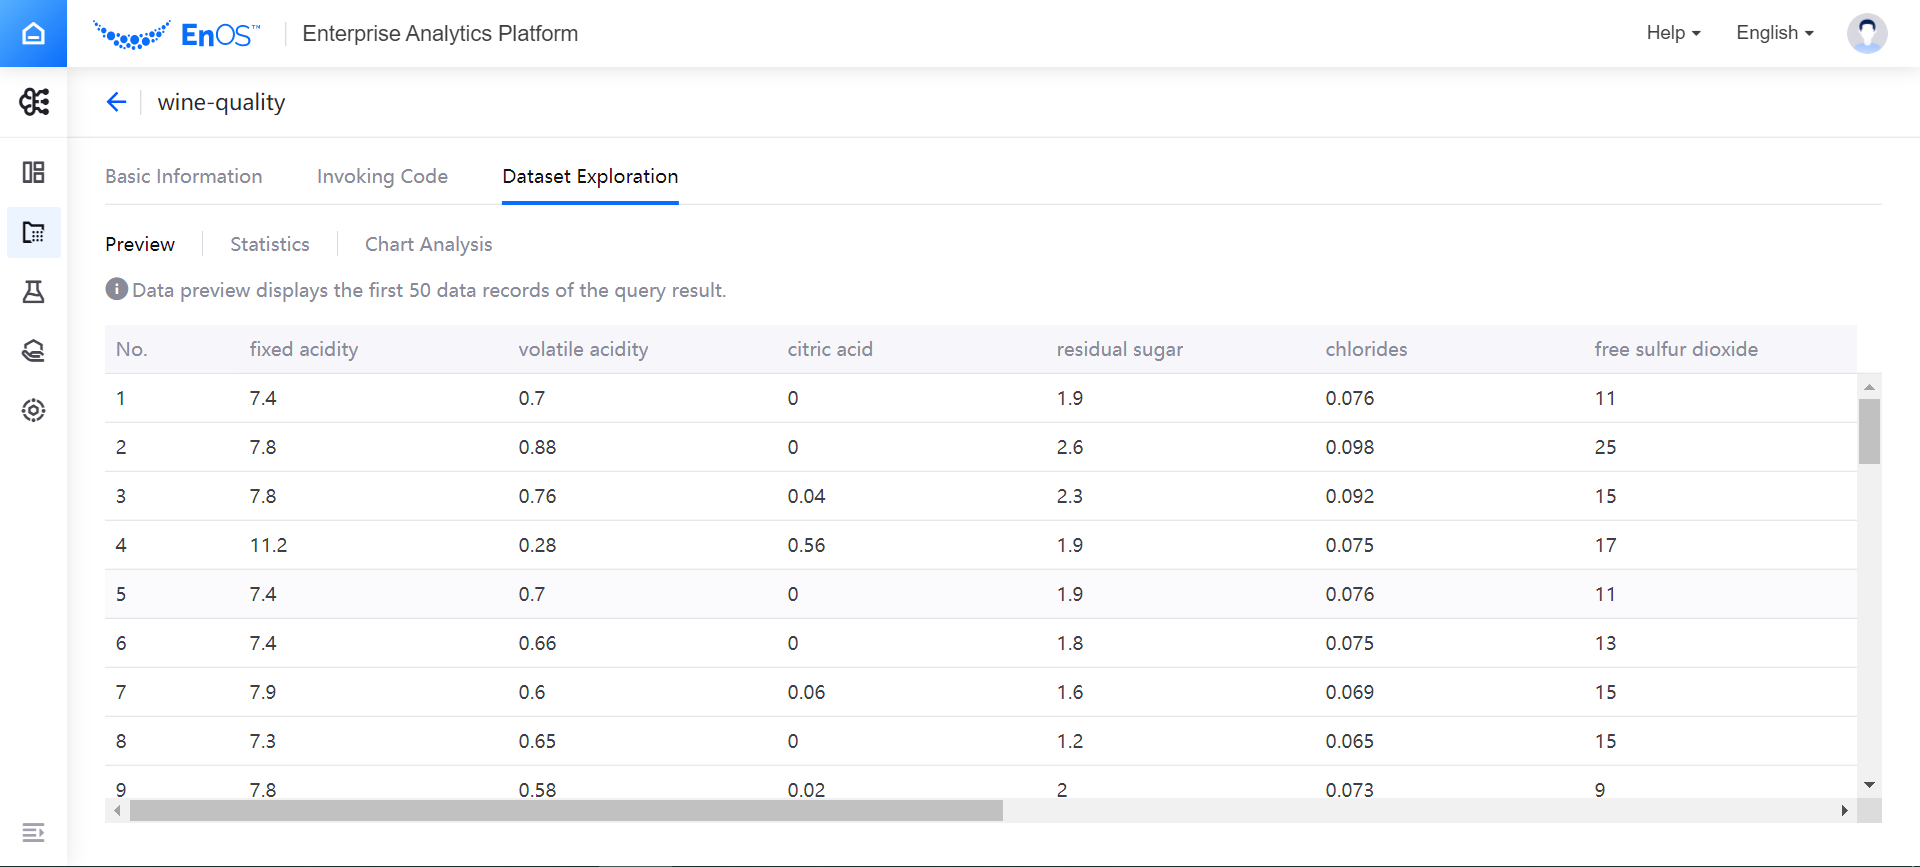
Under the Dataset Exploration tab of the dataset details page, select the Preview.
For Tabular type datasets, the dataset preview can display the first 50 data records of the query result.
For File type datasets, the dataset preview can display the file path, file names, update time, file size, and file extension. For image files, selecting the file name will display the image on the right of the page. Supported image file formats are png, jpg, and jpeg.
Statistical Analysis
Under the Statistics tab of the dataset details page, select New Dataset Exploration Job.
The statistical analysis results show the count of dataset columns and rows, and statistics of each column. The statistical analysis supports analysis of data equivalent to a 3.6GB CSV file. See the following example:
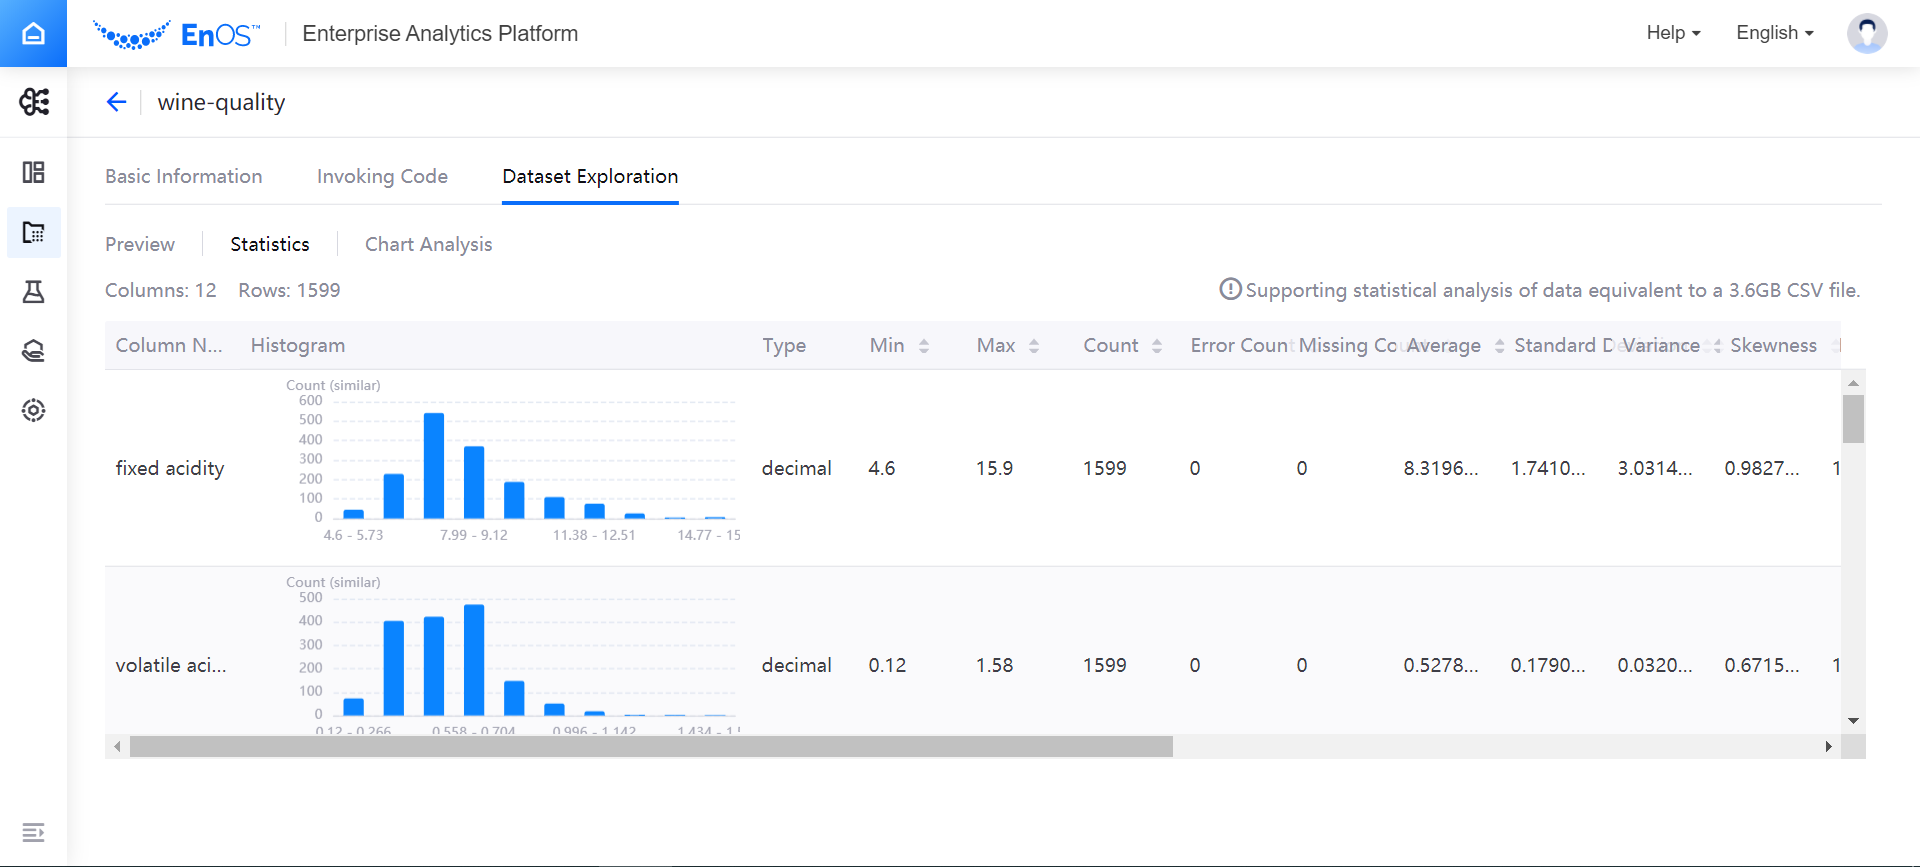
Description of the statistical analysis results is as follows:
The distribution of numerical data is shown as vertical bars.
The distribution of non-numerical data is shown as horizontal bars.
For Tabular type datasets, you can select the feature in each row to view the details of the feature.
The Error Count column displays the number of failed conversion of data types per column.
When you select the New Dataset Exploration Job button again, the system will run another statistical analysis job, and the statistical analysis chart will be refreshed.
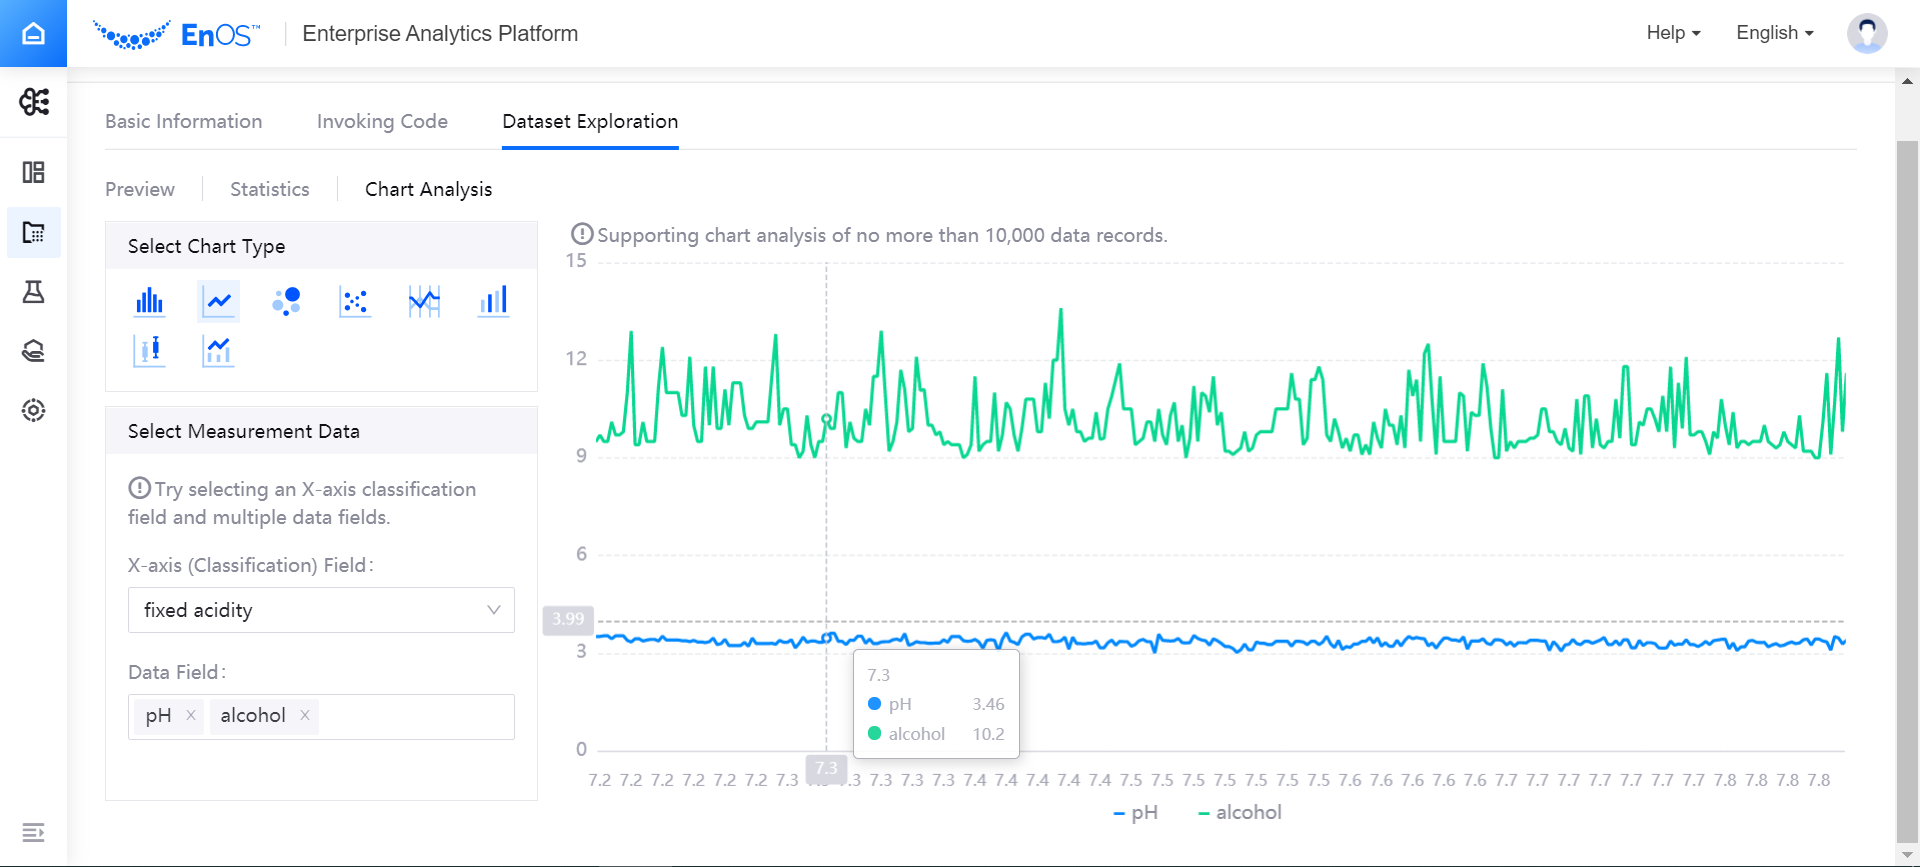
Chart Analysis
Under the Dataset Exploration tab of the dataset details page, select the Chart Analysis. Then, select a chart type and the corresponding measurement data to display and analyze data in the dataset. The chart analysis supports analysis of no more than 10,000 data records. See the following example: